You should include performance tuning as a regular part of administering servers. By tuning the configuration settings of dispatchers and services, you can optimize the speed and efficiency of IBM® Cognos® software. For users, optimal performance means that their reports run fast and without errors. For you, it means that […]
In the era of AI-driven insights, users expect instant answers through natural language queries. This AI-powered chatbot seamlessly connects to your BI engine, delivering key insights without the need to navigate complex BI tools. In this blog, we are producing the same results as shown in above dashboard with the […]
In IBM Cognos Analytics, a Test Visualization (Custom Visualization) allows you to create and integrate custom charts or visual elements beyond the built-in capabilities. This is useful when default charts do not meet specific reporting needs. Reference link for Custom Visualization Setup & Create New Visualization: https://www.ibm.com/docs/en/cognos-analytics/12.0.0?topic=developer-step-by-step-guide-custom-visualizations Guildance Steps to […]
The quick launch scenarios in the Cognos® Analytics welcome page, Upload and create and Create from existing data, now include the option to automatically create a dashboard that is based on the uploaded or selected data source. Therefore, we can generate automatic dashboards in the following ways: From the Upload and create and Create from existing data tiles on […]
As organisations increasingly rely on data-driven decision-making, integrating IBM Cognos Analytics with a cloud-based big data analytics warehouse has become essential. This process describes the steps to connect Cognos Analytics system to a cloud-based big data analytics warehouse. First, we have to download current JDBC drivers from google cloud link. […]
Cognos Analytics offers a Serviceability feature within dashboards, enabling users to access and analyze detailed performance data, including generating SQL queries for the widgets utilized in the dashboard. Below are the steps to open the Serviceability flyout in a dashboard and review SQL queries along with other performance metrics: ⦿ […]
By utilizing the Custom Control functionality in Cognos, it is now possible to create dynamic search and select filters within report outputs. This feature enhances the interactivity of reports, mimicking the functionality of an Excel spreadsheet by allowing users to apply filters directly on column headers to refine data based […]
IBM Cognos Analytics has evolved significantly from Version 11 to Version 12, introducing numerous enhancements to improve user experience, performance, and functionality. Here’s a comparison highlighting key differences between the two versions: Feature Cognos 11 Cognos 12 AI Assistant Introduced narrative insights, basic question answeringOffers AI-driven recommendations for visualizations and […]
This document compares the steps for creating a dashboard using the following two BI tools: Below is the Healthcare sample dashboard which we will produce in IBM Cognos as well as in MS Power BI: Data Source: We will import the raw data in CSV format into both tools and […]
This document compares the steps for creating a dashboard using the following two BI tools: Below is the Healthcare sample dashboard which we will produce in IBM Cognos as well as in MS Power BI: Data Source: We will import the raw data in CSV format into both tools and […]
 You should include performance tuning as a regular part of administering servers. By tuning the configuration settings of dispatchers and services, you can optimize the speed and efficiency of IBM® Cognos® software. For users, optimal performance means that their reports run fast and without errors. For you, it means that […]
 In the era of AI-driven insights, users expect instant answers through natural language queries. This AI-powered chatbot seamlessly connects to your BI engine, delivering key insights without the need to navigate complex BI tools. In this blog, we are producing the same results as shown in above dashboard with the […]
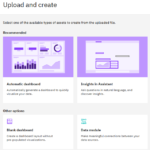 The quick launch scenarios in the Cognos® Analytics welcome page, Upload and create and Create from existing data, now include the option to automatically create a dashboard that is based on the uploaded or selected data source. Therefore, we can generate automatic dashboards in the following ways: From the Upload and create and Create from existing data tiles on […]
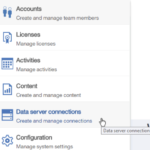 As organisations increasingly rely on data-driven decision-making, integrating IBM Cognos Analytics with a cloud-based big data analytics warehouse has become essential. This process describes the steps to connect Cognos Analytics system to a cloud-based big data analytics warehouse. First, we have to download current JDBC drivers from google cloud link. […]
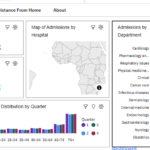 Cognos Analytics offers a Serviceability feature within dashboards, enabling users to access and analyze detailed performance data, including generating SQL queries for the widgets utilized in the dashboard. Below are the steps to open the Serviceability flyout in a dashboard and review SQL queries along with other performance metrics: ⦿ […]
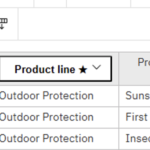 By utilizing the Custom Control functionality in Cognos, it is now possible to create dynamic search and select filters within report outputs. This feature enhances the interactivity of reports, mimicking the functionality of an Excel spreadsheet by allowing users to apply filters directly on column headers to refine data based […]
 IBM Cognos Analytics has evolved significantly from Version 11 to Version 12, introducing numerous enhancements to improve user experience, performance, and functionality. Here’s a comparison highlighting key differences between the two versions: Feature Cognos 11 Cognos 12 AI Assistant Introduced narrative insights, basic question answeringOffers AI-driven recommendations for visualizations and […]
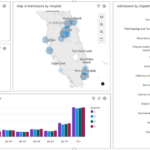 This document compares the steps for creating a dashboard using the following two BI tools: Below is the Healthcare sample dashboard which we will produce in IBM Cognos as well as in MS Power BI: Data Source: We will import the raw data in CSV format into both tools and […]
 This document compares the steps for creating a dashboard using the following two BI tools: Below is the Healthcare sample dashboard which we will produce in IBM Cognos as well as in MS Power BI: Data Source: We will import the raw data in CSV format into both tools and […]