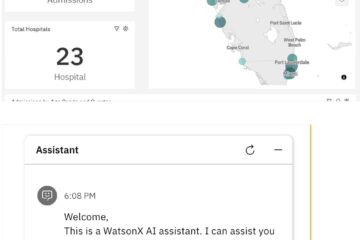
Cognos Analytics offers a Serviceability feature within dashboards, enabling users to access and analyze detailed performance data, including generating SQL queries for the widgets utilized in the dashboard.
Below are the steps to open the Serviceability flyout in a dashboard and review SQL queries along with other performance metrics:
⦿ In Team content, navigate to your dashboard and click it to open it.
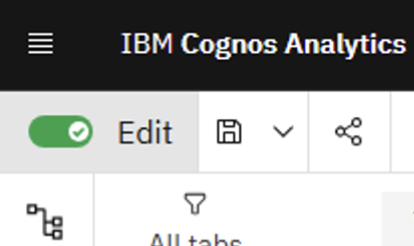
⦿ Click the Edit icon ![]() to go in Author mode.
to go in Author mode.
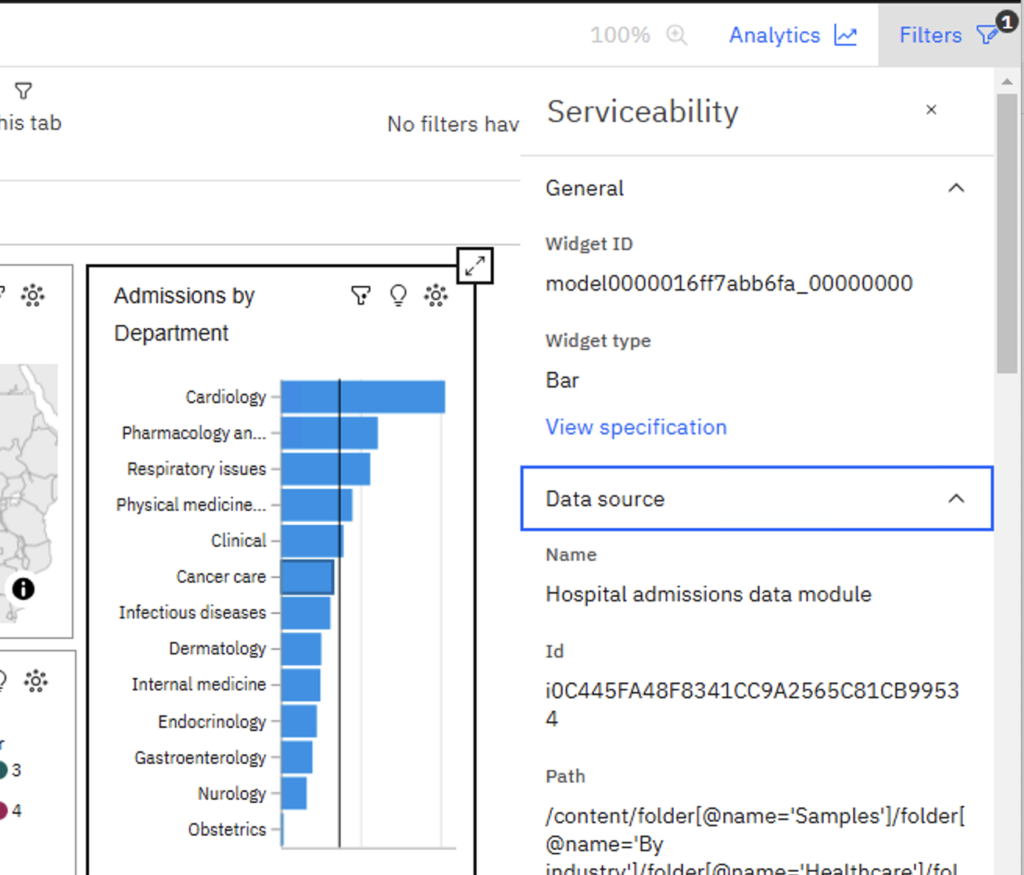
⦿ Select a widget and press Ctrl + . (period). The Serviceability flyout opens.
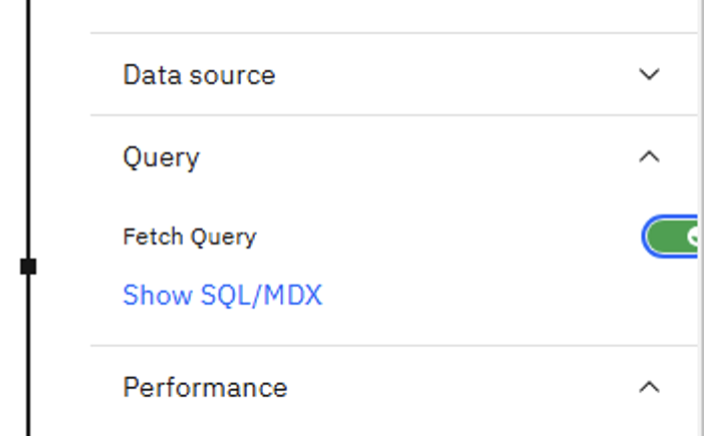
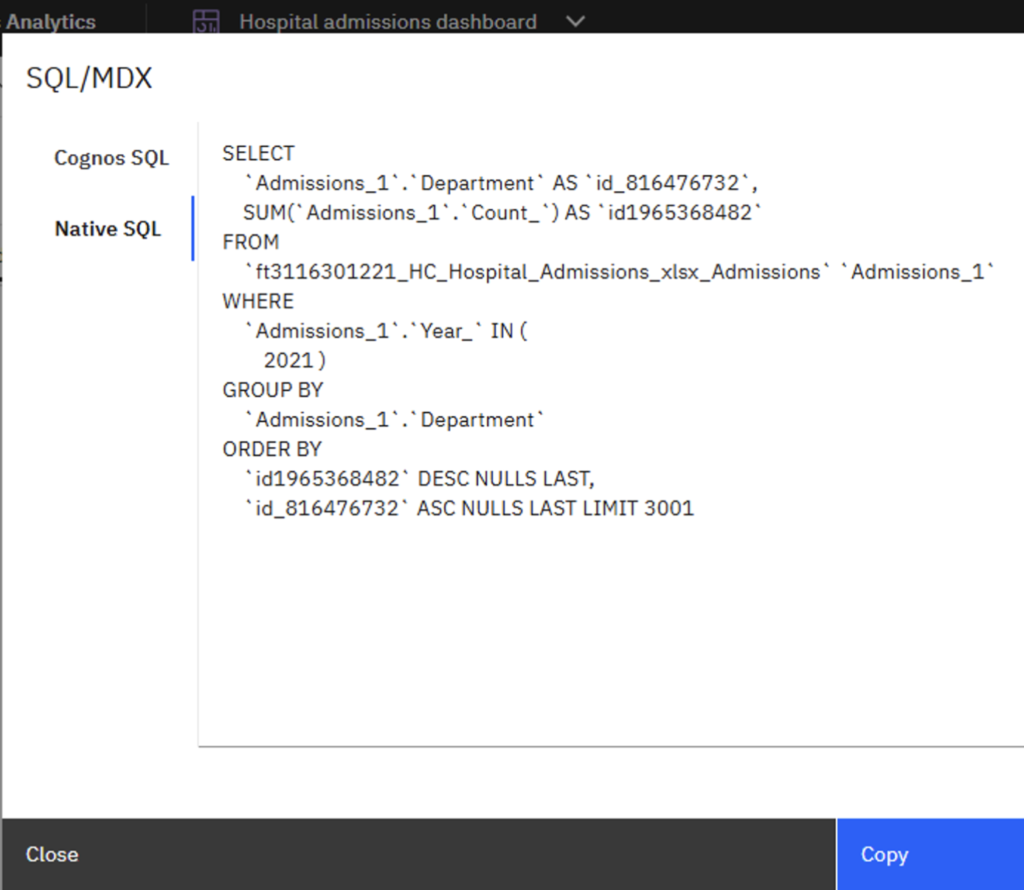
⦿ Navigate to the Query tab and enable the Fetch Query option. This action will activate the Show SQL/MDX link.
⦿ Click the link to generate the SQL query for selected widget. It displays both Cognos and Native SQL.
Note: Cognos & Native SQL options are available from Cognos 12 onwards while Cognos 11 shows only Cognos SQL.
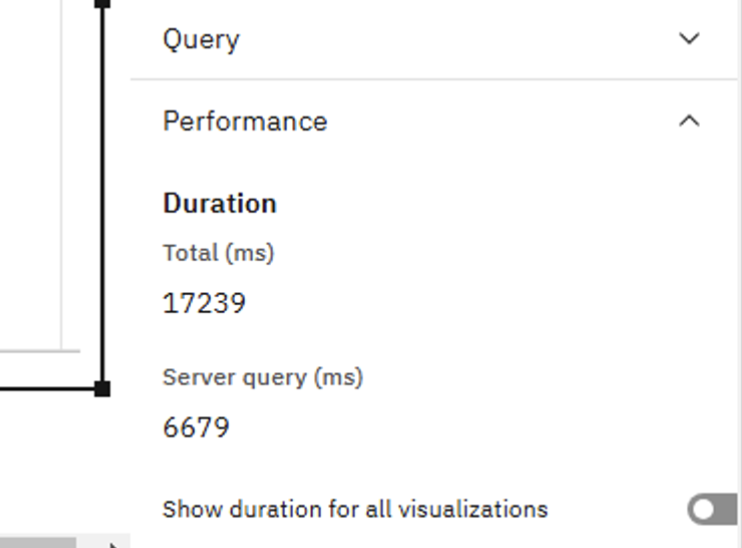
⦿ Similarly, the total duration required for the selected widget to render data can be reviewed in the Performance tab.
⦿ Enabling the ‘Show Duration for All Visualizations’ option displays the query and rendering duration for each widget directly on top of the respective visualizations.
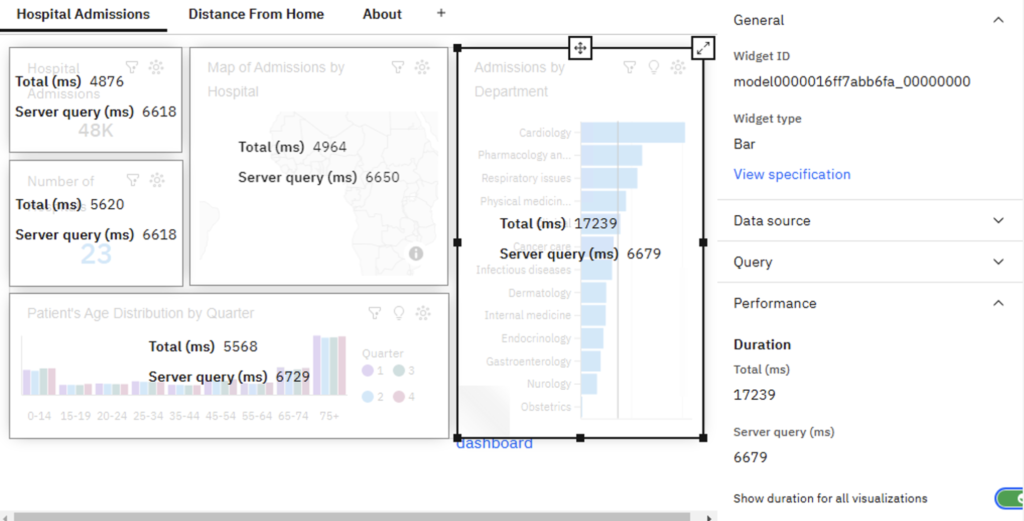
Therefore, the Serviceability feature serves as a valuable tool for accessing and analyzing detailed performance data for your dashboards.

