In IBM Cognos Analytics, a Test Visualization (Custom Visualization) allows you to create and integrate custom charts or visual elements beyond the built-in capabilities. This is useful when default charts do not meet specific reporting needs.
Reference link for Custom Visualization Setup & Create New Visualization: https://www.ibm.com/docs/en/cognos-analytics/12.0.0?topic=developer-step-by-step-guide-custom-visualizations
Guildance Steps to follow:
Installing Node.JS and NPM
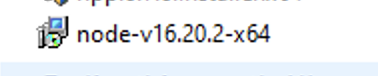
- Download NodeJS version 16, for Cognos Analytics 12.0.0 – 12.0.3, or version 20 installer, for Cognos Analytics 12.0.4, from https://nodejs.org/en/download/.
- Run the installer and use the default settings.
- After the installation, restart your computer.
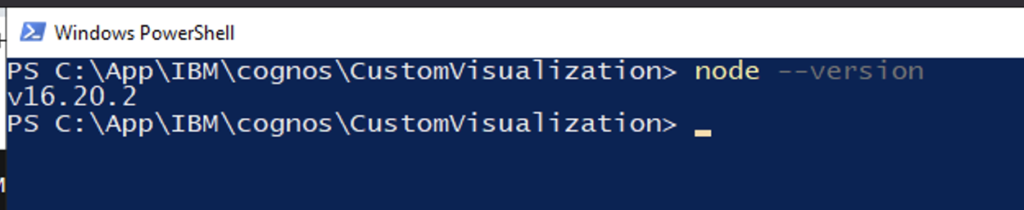
- Validate the node and npm installation.
- Open a command-line interface (CLI). Powershell or CMD on Windows.
- Run the following command:
node --version - The CLI displays the current version of the node. Make sure it meets the prerequisites.
Installing the Cognos Analytics custom visualizations CLI tools
- Download the Cognos Analytics custom visualizations command-line tools from [CAserverroot]/bi/js/vida/customvis.tgz.
- In your file browser, navigate to the directory where the downloaded file is saved to.
- Open a command-line tool (Windows PowerShell or CMD).
- Run the following command:
npm install -g customvis.tgz
- After the process is completed, run the following command to validate the custom visualizations CLI tools.
customvis --help- The CLI displays the available commands.
- In your file browser, delete the file customvis.tgz.
Creating a custom visualization
- Open a command-line interface (CLI) in one of your chosen directories and run the following command:
customvis create CustomVisualization- A directory with the name CustomVisualization is created.
- You can choose another name instead of CustomVisualization. For example, Test_CV, which creates a new directory called Test_CV.
- In the CLI change the directory, by running:
cd CustomVisualization
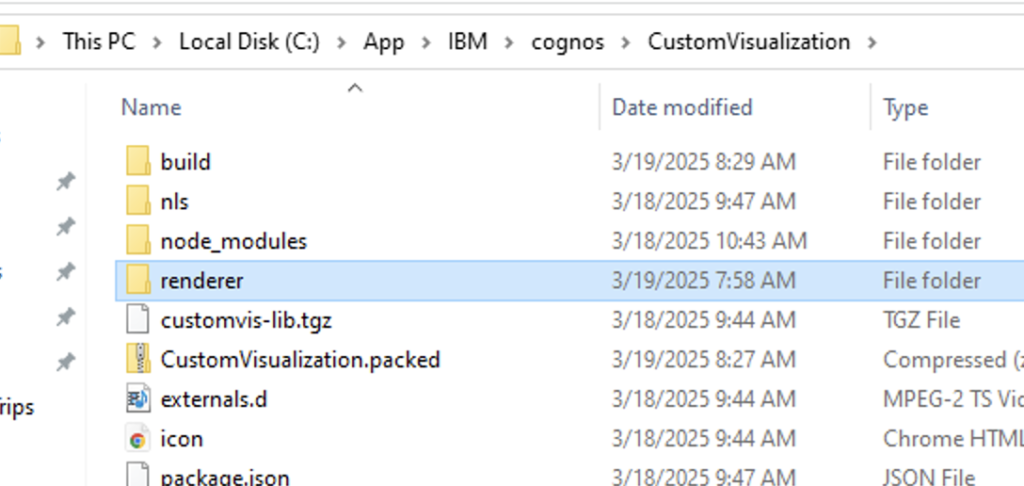
- When you develop a custom visualization, the custom visualizations CLI tools build the sources.
- The sources for the bundle are located in the /renderer directory.
- You can now start implementing the visualization.
Using a D3 sample in your custom visualization
- Open a command-line interface (CLI) in the CustomVisualization directory and run the following command:
customvis start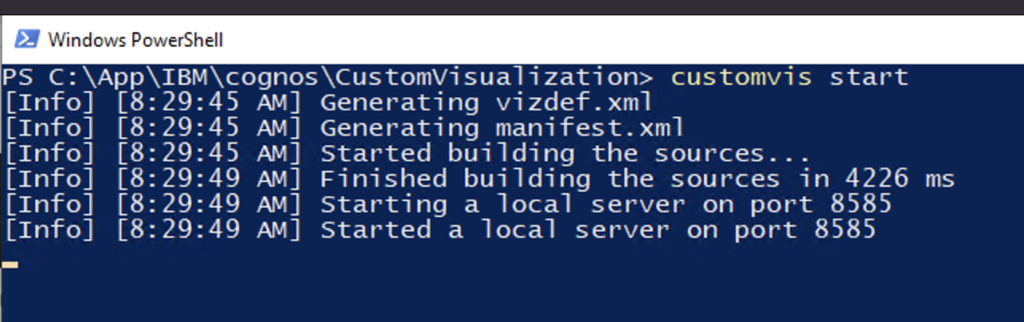
- This command builds the sources and starts a local server that hosts the custom visualization.
- To stop the local server that hosts the custom visualization, press Ctrl C.
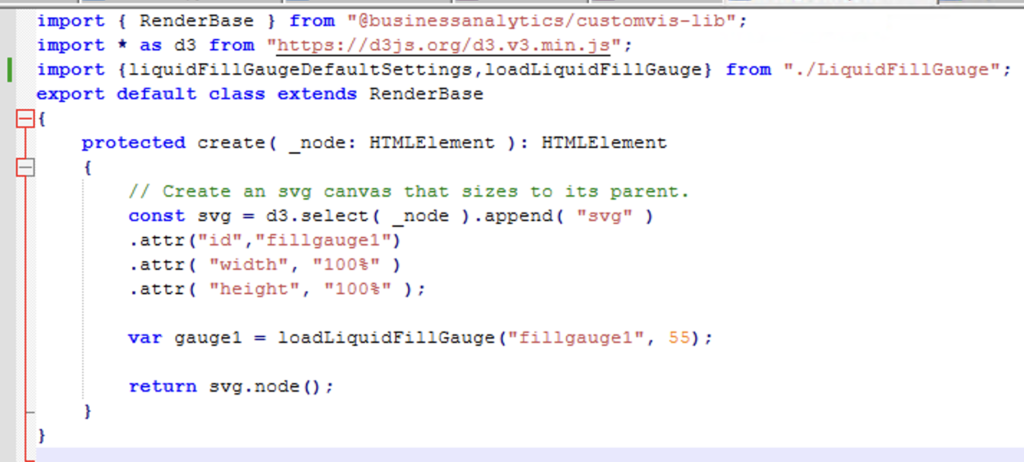
- Edit the Main.ts file in such a way that the D3 example can be used in IBM® Cognos Analytics.
- Note: D3 Liquid Fill Gauge: https://gist.github.com/brattonc/5e5ce9beee483220e2f6
- Note: D3 Liquid Fill Gauge: https://gist.github.com/brattonc/5e5ce9beee483220e2f6
- Save the file. If everything works correctly, the CLI displays that the sources finished building.
Validating the visualization
- You can now validate the custom visualization in Cognos Analytics.
- Now to go Cognos Analytics and start creating a new report.
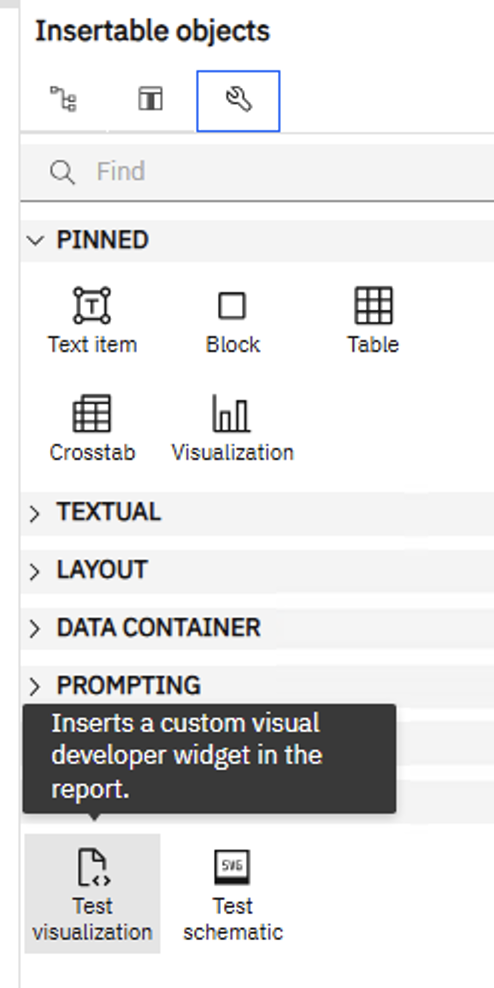
- Insert the ‘Test Visualization’ from Insertable objects > Developer
4. Once added to canvas, it shows below;
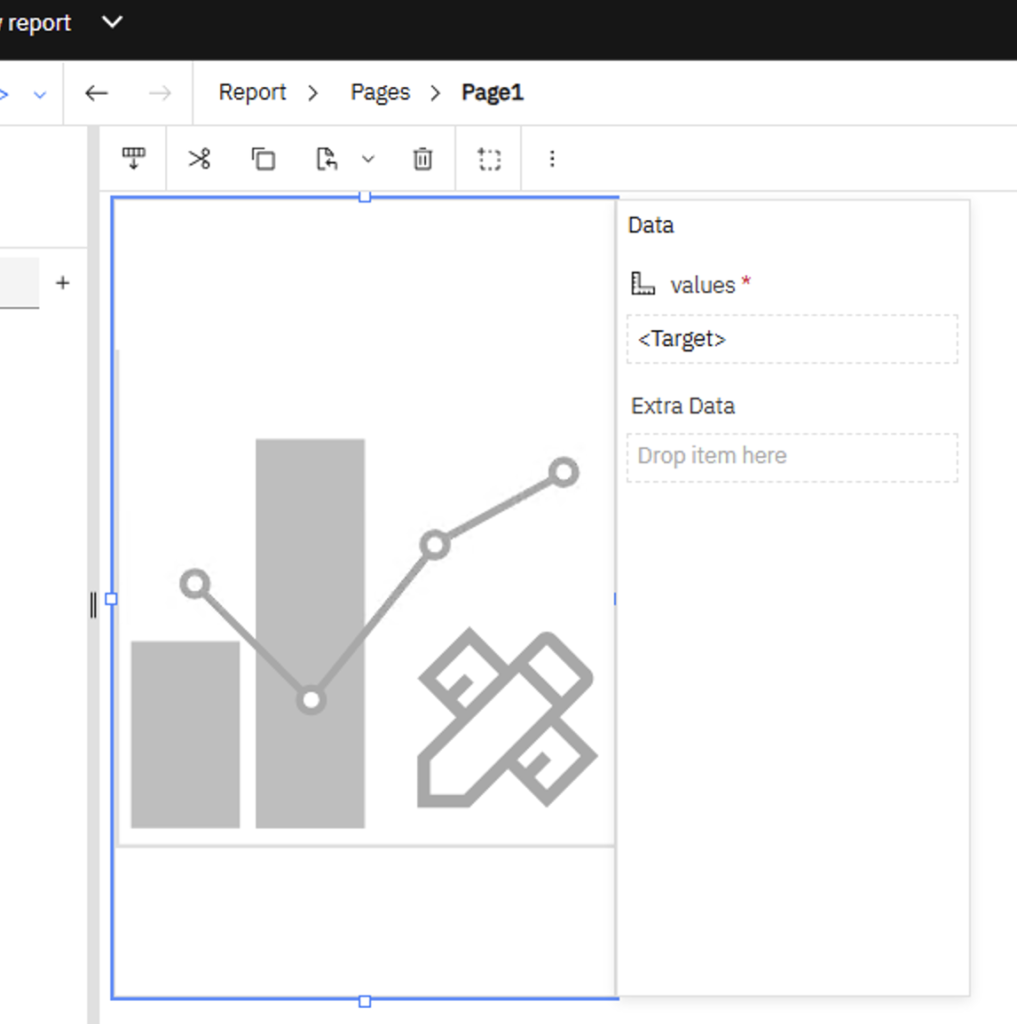
5. Add the data to values field and run the report.
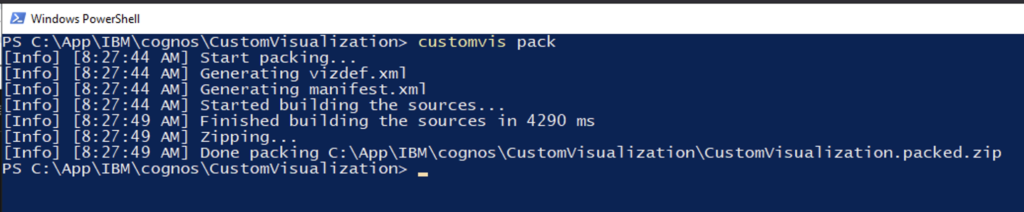
Package and deploy the custom visualization
- When the custom visualization is ready to be published, you can use the custom visualization command-line interface (CLI) tools to build and pack the visualization.
- Once the package is built. It saves in the CustomVisualization directory.
- Upload this packed visualization to IBM® Cognos Analytics.
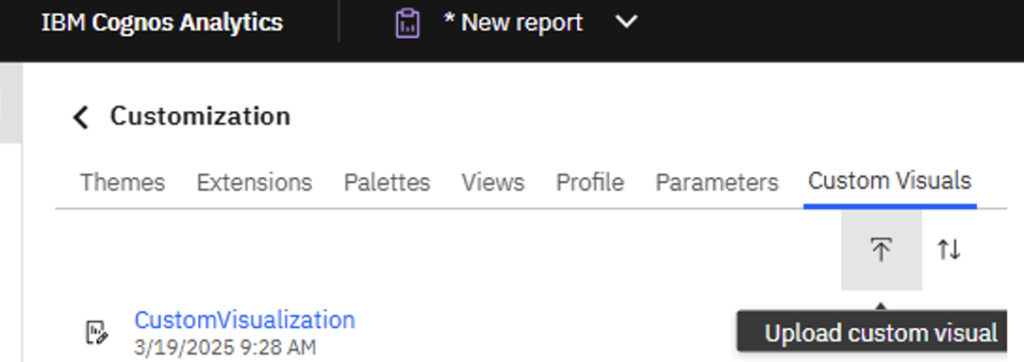
- Go to Manage > Customiztion > Custom Visuals
- Go to CustomVisualization directory and upload the package file.
- Once uploaded successfully, it will display in Custom Visuals.
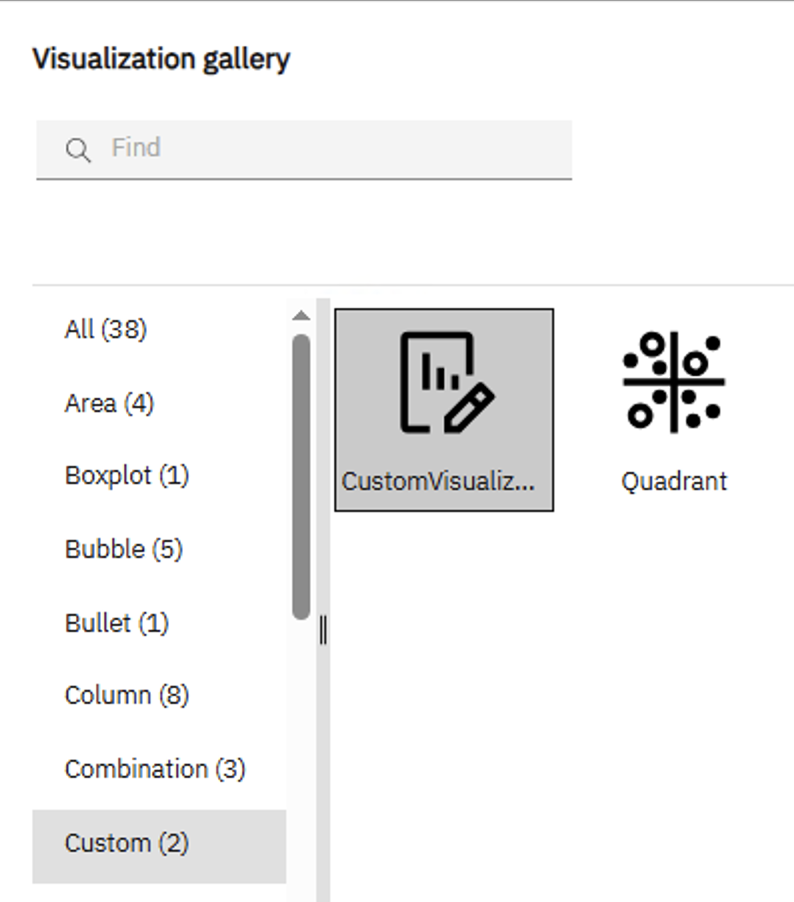
- Now, open the report and drag the visualization into canvas.
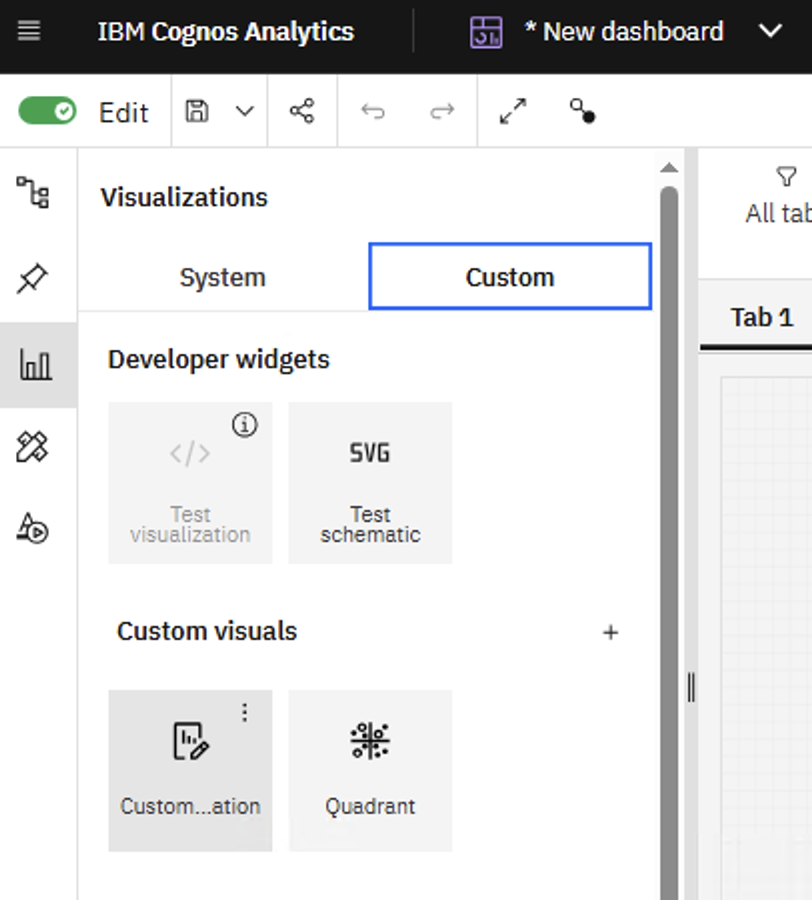
- Go to custom tab and newly uploaded visualization will appear here.
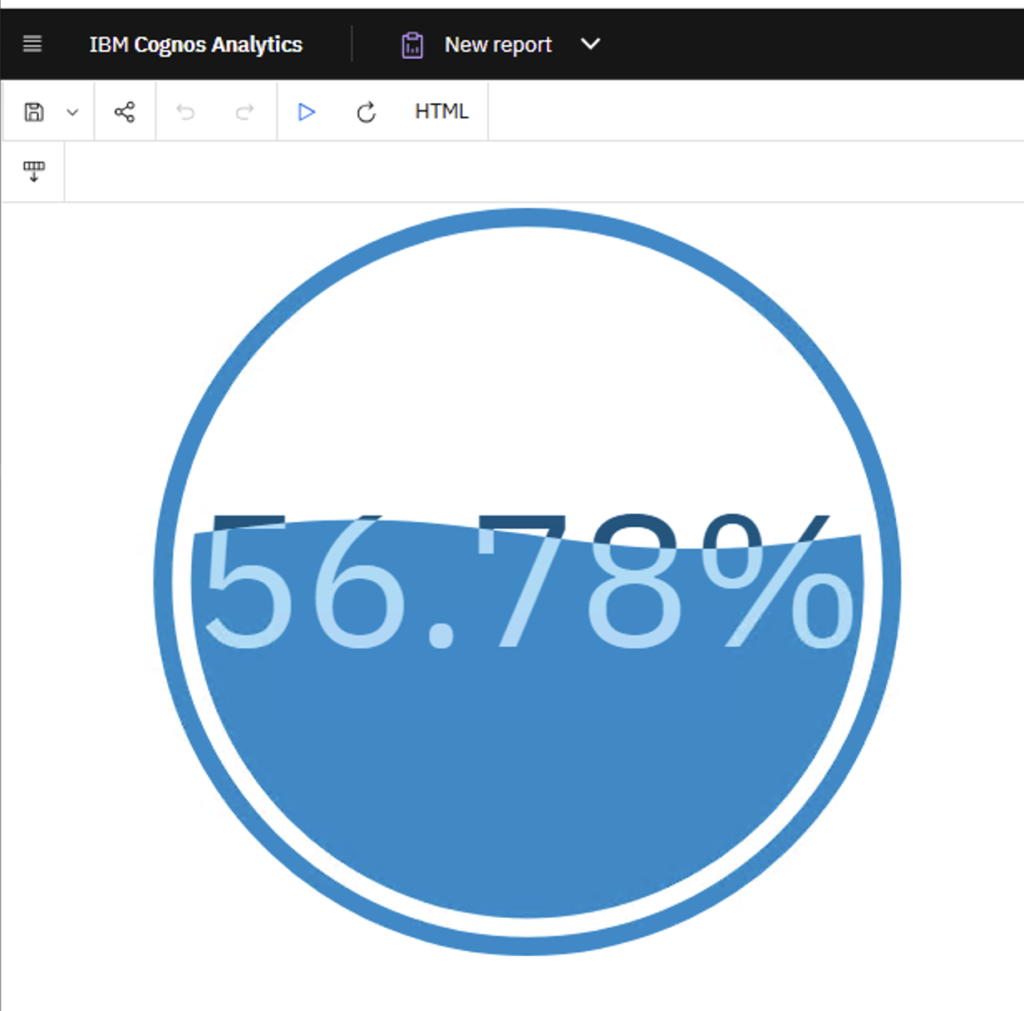
- Use it Cognos report and it appear in output as show below:
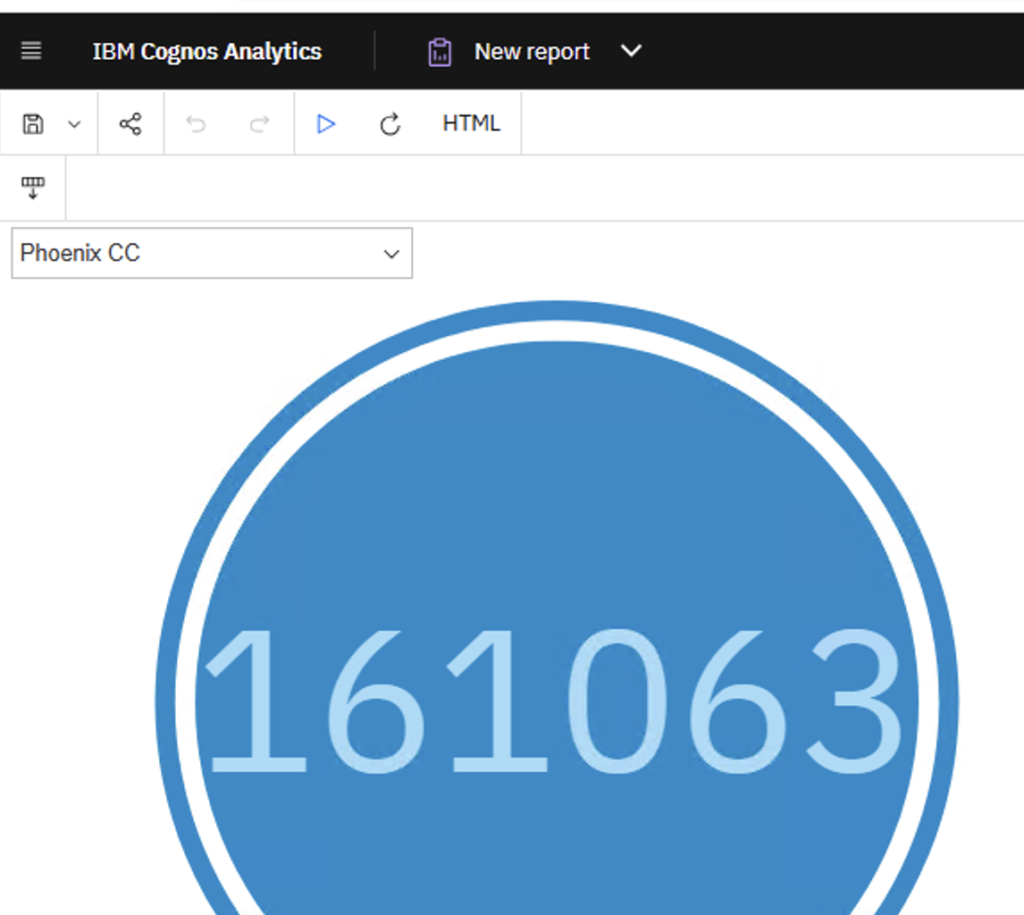
- Note: To use the same in Cognos dashboard, go to Visualization > Custom