Log in to IBM Cognos Analytics 12.1.3
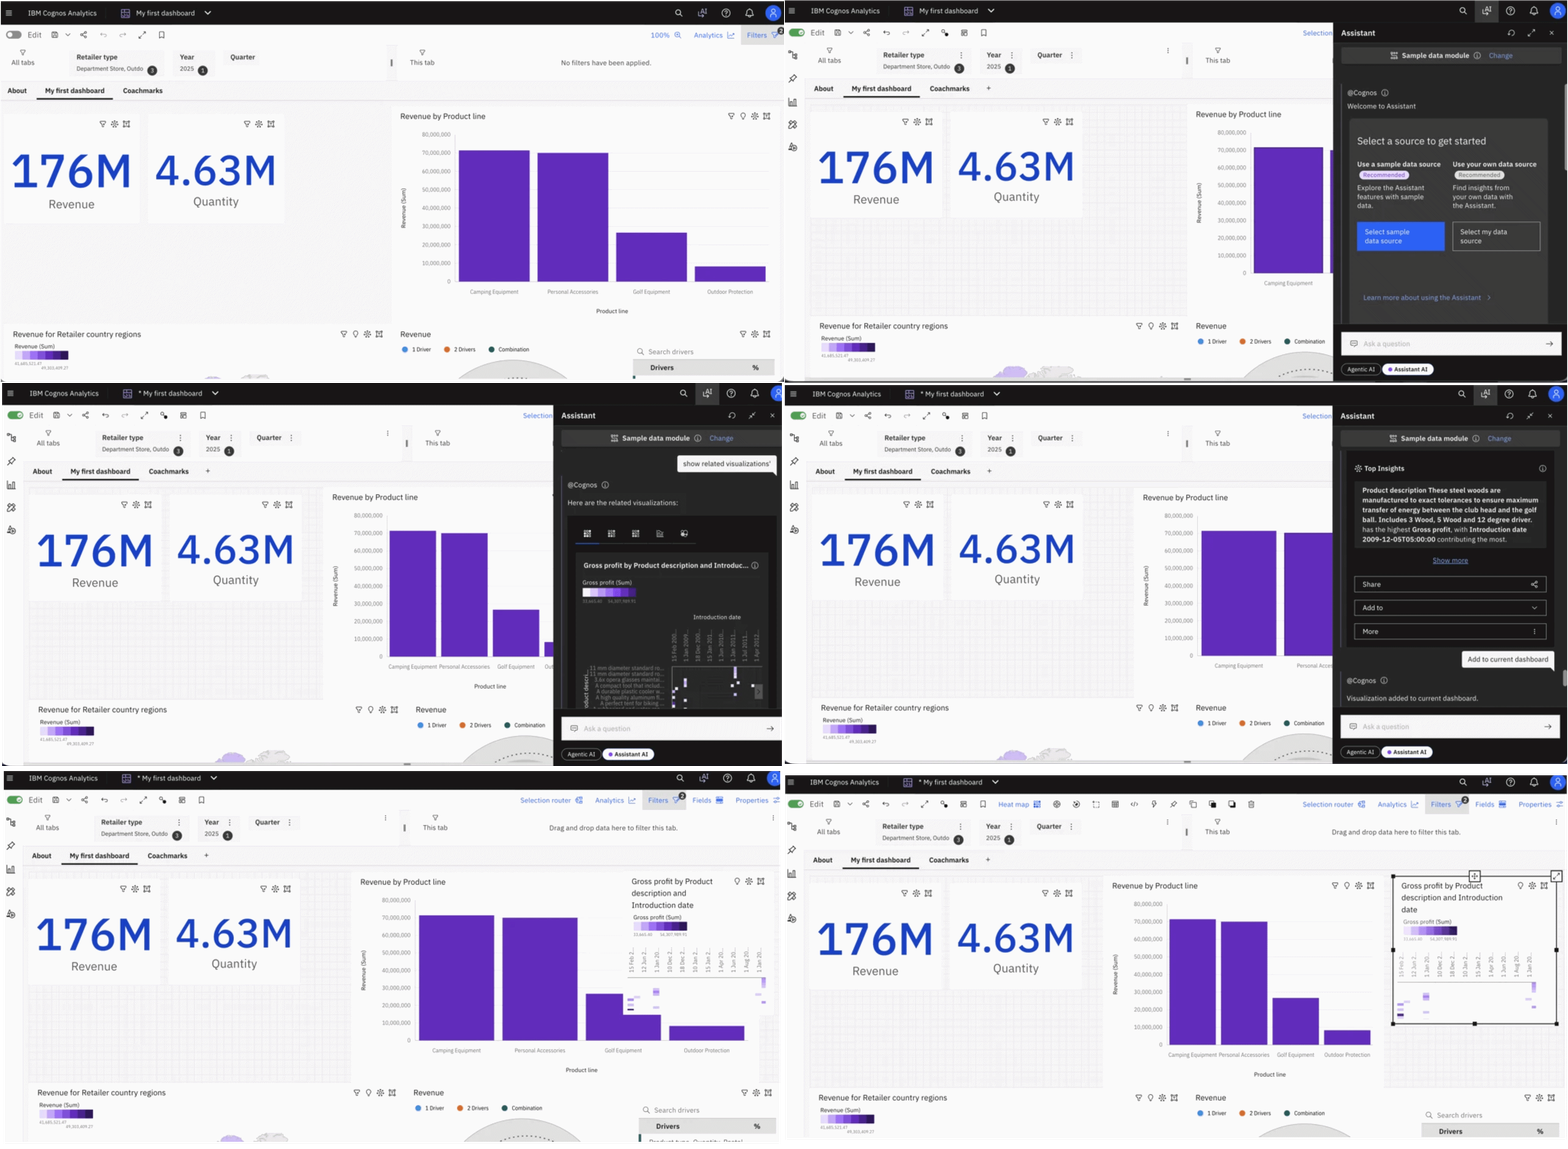
Open an existing dashboard : Navigate to the dashboard you want to enhance. Open the dashboard and review the existing visualizations to identify an area where additional analysis would be useful.

Turn on the Authoring or Edit mode in dashboard
Open AI Assistant
Open the AI interface from top right side in Cognos Analytics.

Select the Assistant AI at bottom.

Assistant AI automatically selects the data module of opened dashboard.
Request a related visualization: Enter “show a related visualization”.
Once visualization is generated, review it to ensure that it uses the appropriate data fields, measures, aggregation, and chart type.

Add the generated chart to dashboard:
Once satisfied, add the chart to current dashboard by selecting an option from “Add to > Current dashboard”
Note: Current Dashboard will be visiable only if the dashboard is opened in Edit mode only.

OR enter the same directly in the input box:

Arrange and save the dashboard:
Position the new chart appropriately, adjust its size and title, and verify that it works correctly with the existing dashboard filters and interactions. Save the dashboard to retain your changes.

Save the dashboard.

Benefits
- Reduced manual effort: Generate relevant charts using natural-language instructions.
- Faster analysis: Explore additional business questions without starting from scratch.
- Improved dashboards: Extend existing dashboards with complementary visualizations.
- Better accessibility: Enable users to express analytical requirements in everyday language.
Conclusion
Generating related visualizations using Agentic AI in Cognos Analytics 12.1.3 can make dashboard enhancement more conversational and efficient. Users can describe the insights they need, review the resulting visualization, and incorporate it into their existing analytical workflow.