BM Cognos Analytics 12.1.3 introduces Custom Tooltips, a useful reporting enhancement that allows report authors to display additional business measures when users hover over chart data points.
Previously, adding more information to a chart often meant displaying additional measures directly in the visualization, which could make charts crowded and harder to interpret.
With Custom Tooltips, authors can provide additional context without compromising the simplicity of the chart.
For example, a sales chart can display Revenue as its primary measure while showing additional information such as Gross Profit, Profit Margin, or Unit Sale Price when a user hovers over a data point.
Note: These extra values, measures or single values, can be now added in Reporting in 11.1 visualizations. However, this feature is not available in following charts:
- Area
- Bullet
- River
- Smooth area
- Step area
- Schematics
Follow these steps to configure additional data values in a chart tooltip.
Log in to IBM Cognos Analytics.
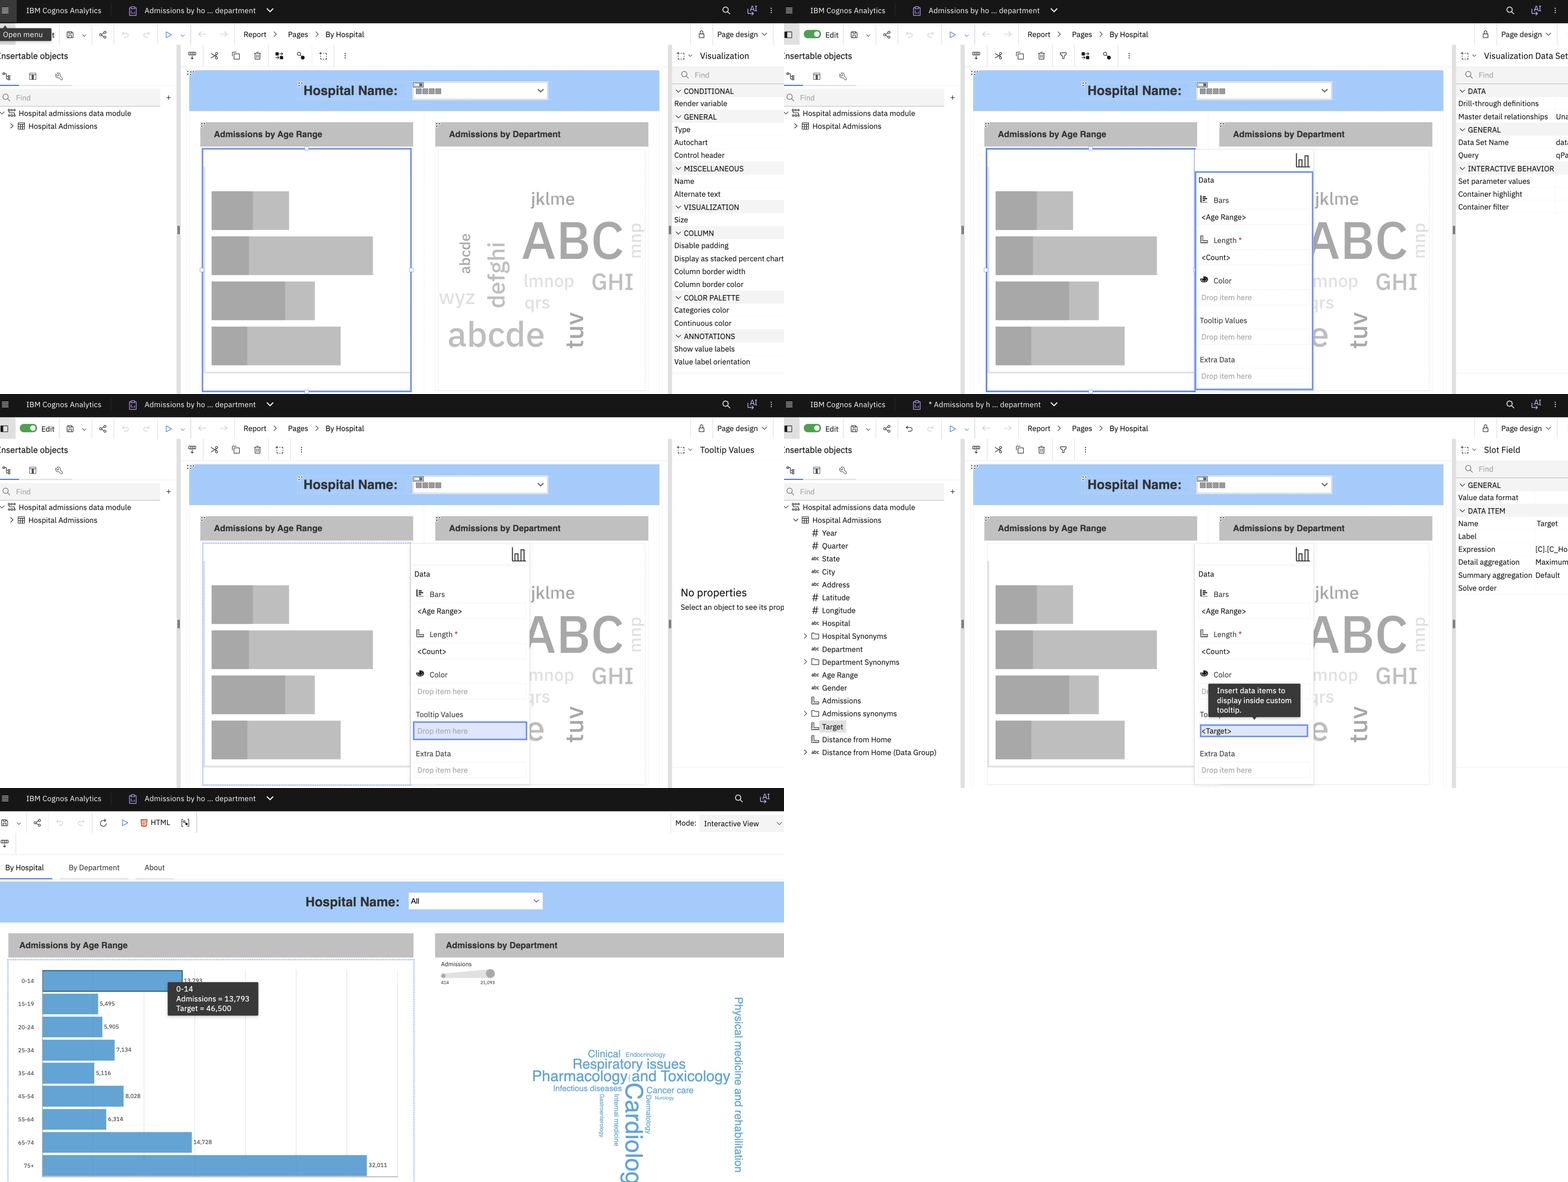
Navigate to the report you want to modify and open it in Edit mode.
Add a chart visualization or select an existing chart.
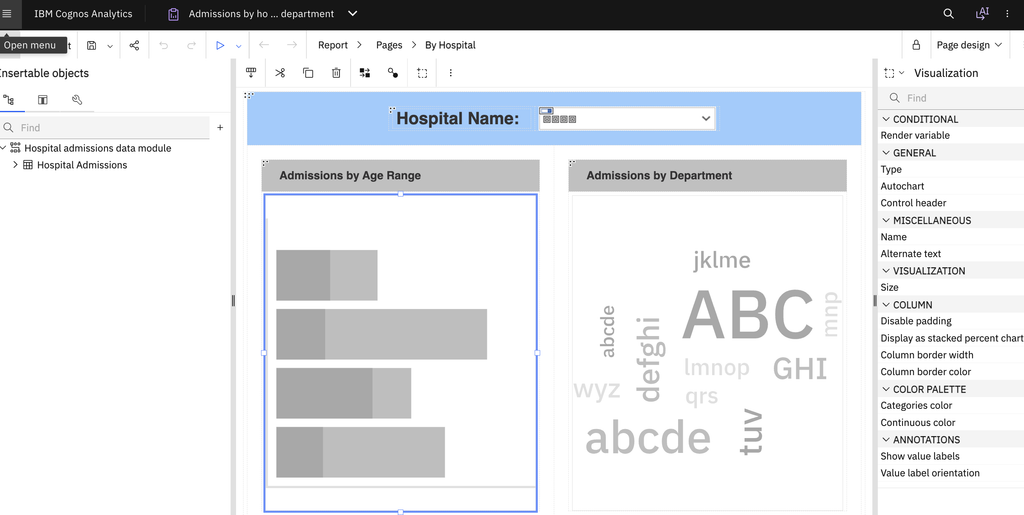
Select the Data pane of chart.
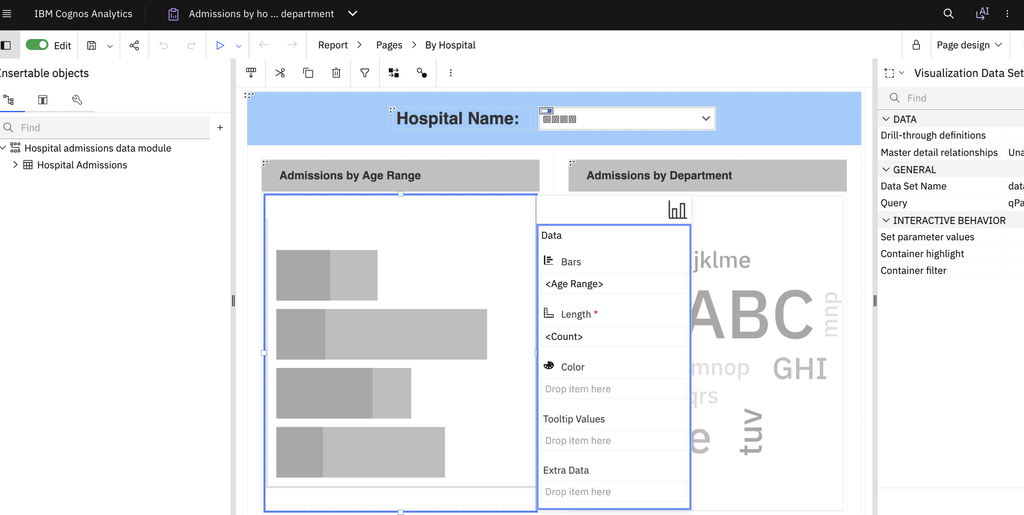
You will see Tooltip Values in it.
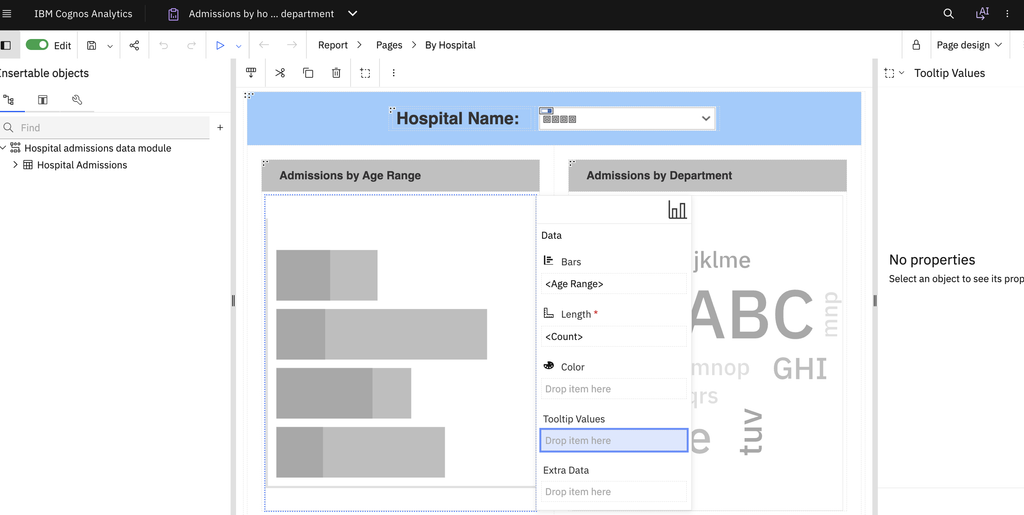
Drag the additional measure into the Tooltip values data field.
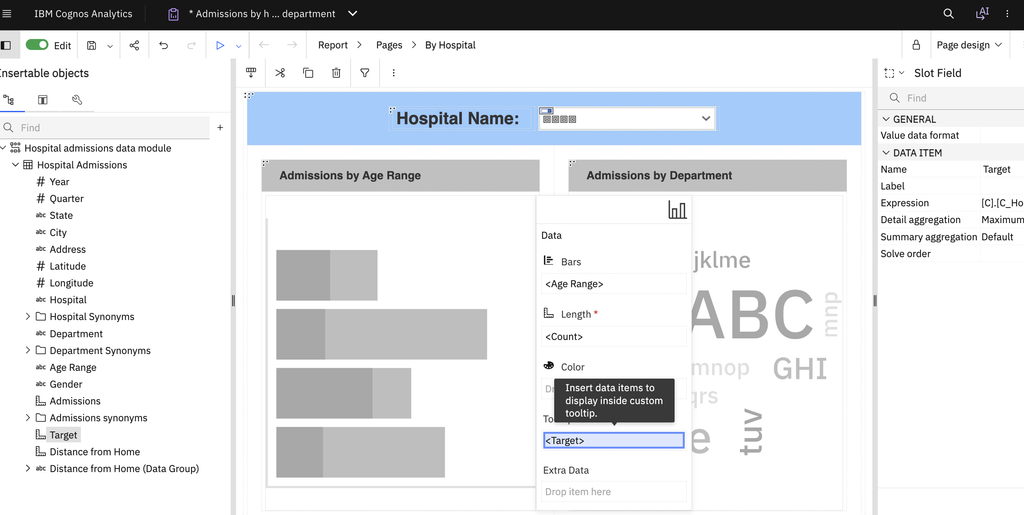
Note: You can add multiple measures, depending on the information required.
Save the report and run it in HTML output.
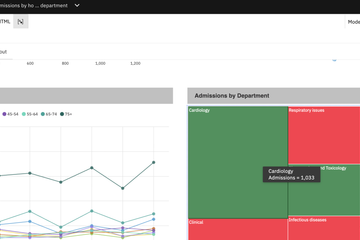
Hover over different chart data points.
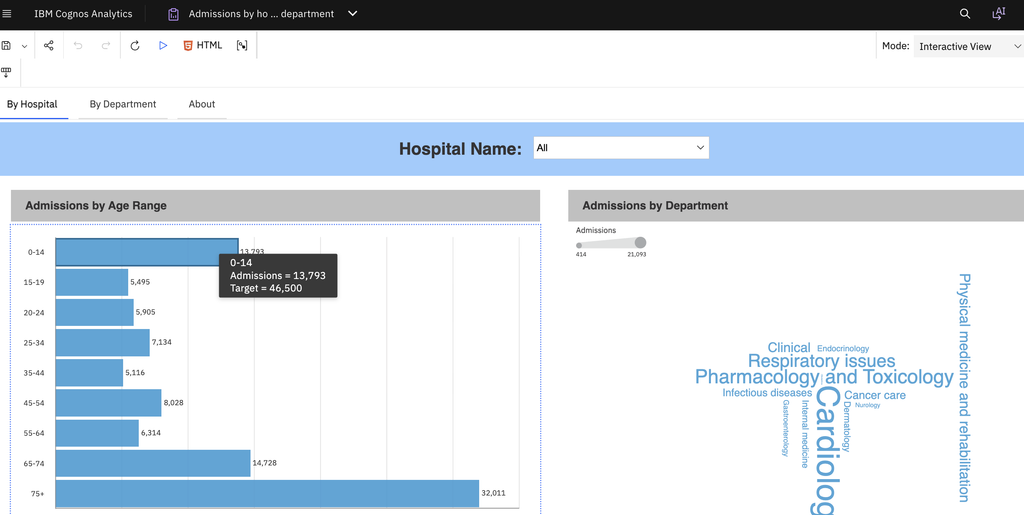
Verify that the tooltip displays the additional measures for the corresponding data point.
You can repeat the configuration to include other relevant measures based on your reporting requirements.