Creating a dashboard in traditional Business Intelligence (BI) tools often requires choosing visualizations, configuring measures, and arranging charts. With the AI Assistant in IBM Cognos Analytics, users can simplify this process by asking questions in natural language.
Instead of manually starting every visualization from scratch, users can describe their analytical requirements and allow the Assistant to help explore data, generate visualizations, and create a dashboard.
Steps to Create a New Dashboard
Step 1: Access the Assistant and Select a Data Source
First, log in to IBM Cognos Analytics and open the Assistant panel from the side navigation.
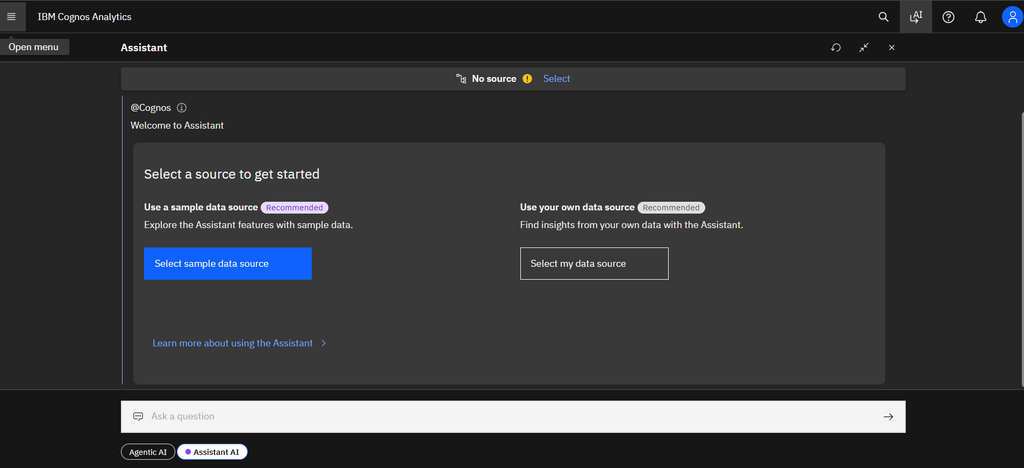
When the Assistant opens, the interface displays the message “Select a source to get started” with two options:
- Use a sample data source
- Use your own data source
For this demonstration, we will use a sample data source provided by Cognos Analytics.
Step 2: Browse and Select the Data Module
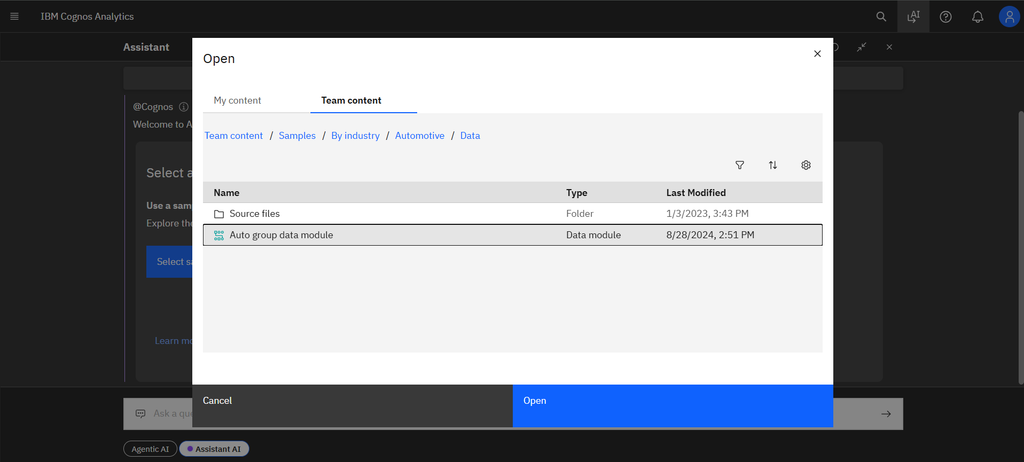
After selecting the option to choose a data source, a file selection window titled “Open” appears.
Select the data module named Auto group data module and click the blue Open button.
This data module will serve as the source for our analysis.
Step 3: Confirm the Data Source Connection
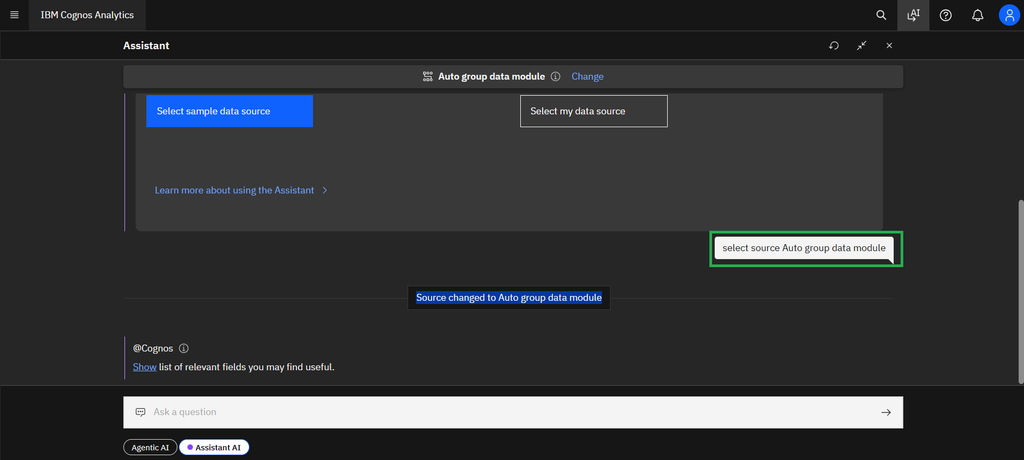
Once the data module is selected, the Assistant connects to the source.
A notification appears at the bottom of the chat panel:
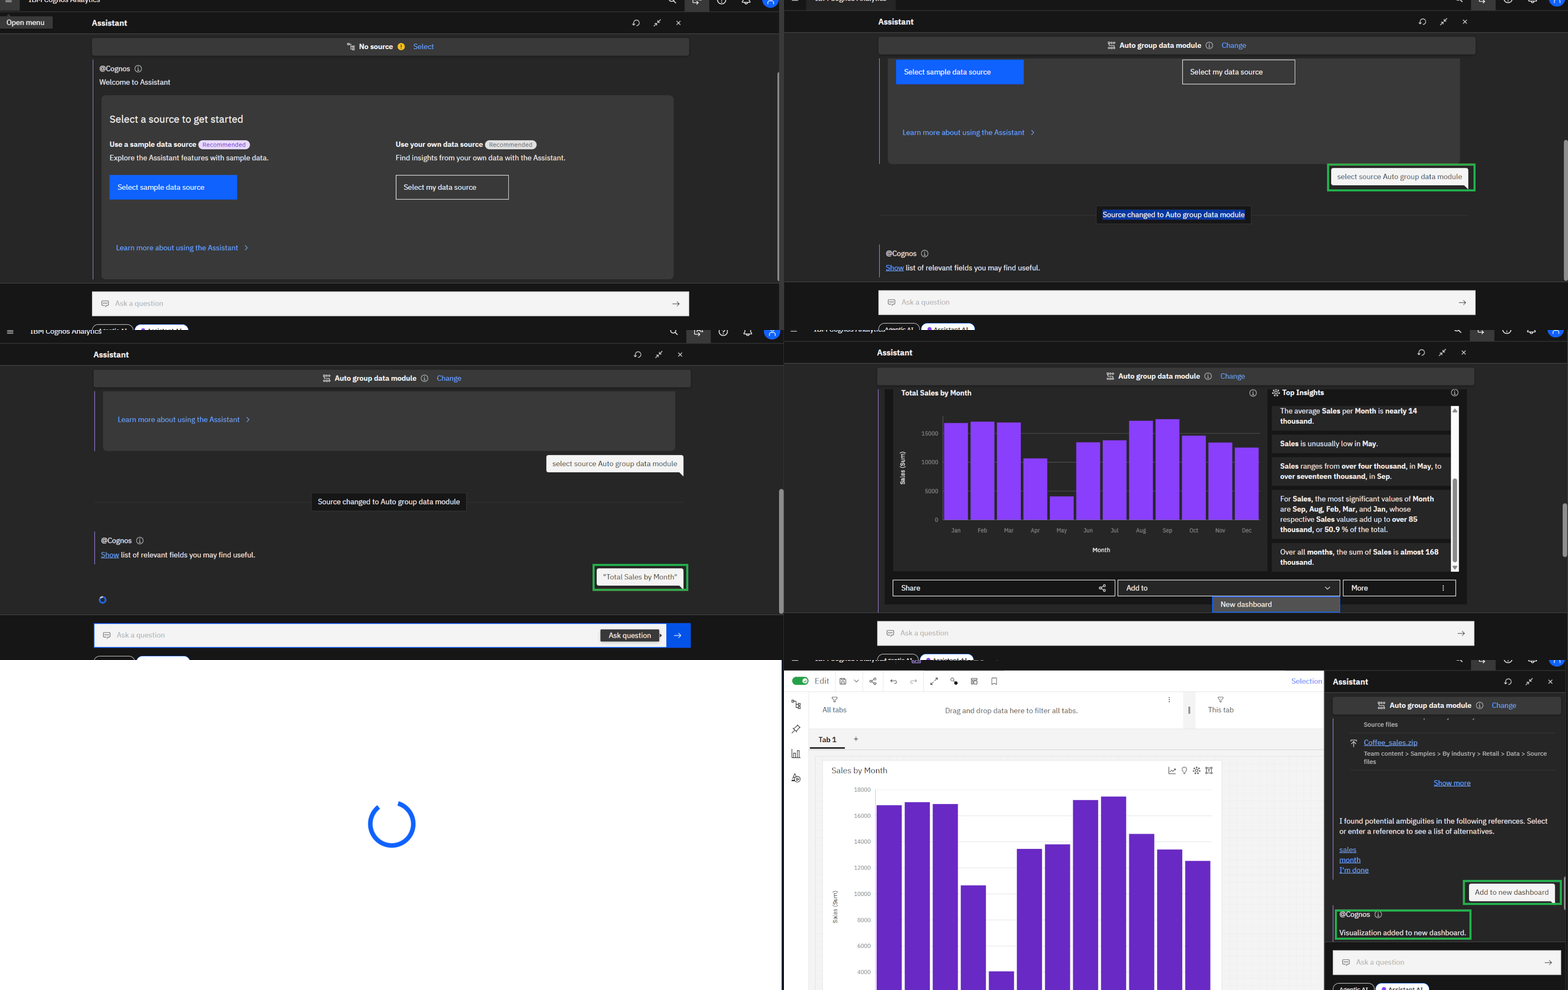
“Source changed to Auto group data module”
This confirms that the Assistant is now using the selected data module to answer questions and generate visualizations.
Step 4: Ask the AI Assistant a Business Question
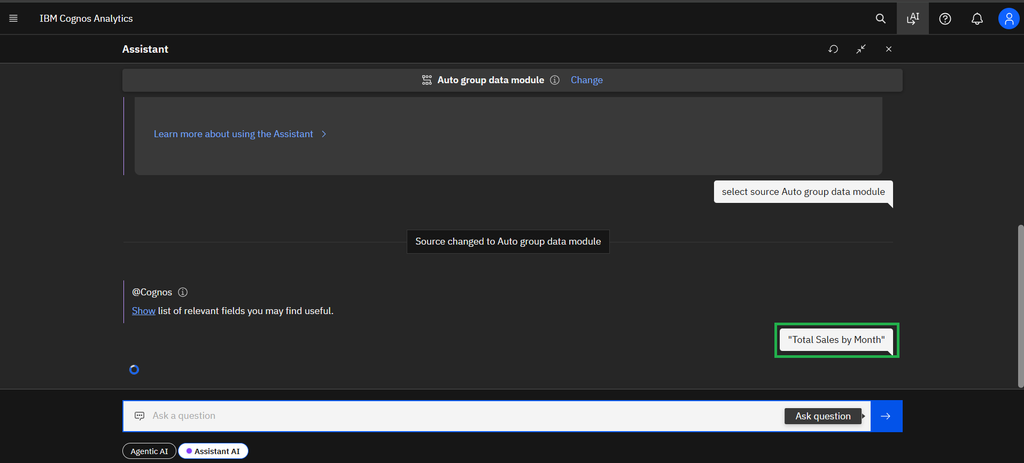
Now that the data source is connected, enter your query in the input box labeled “Ask a question”.
For this example, enter:
Total Sales by Month
The Assistant interprets the request and identifies the relevant fields from the data module to create a visualization.
This natural-language approach allows users to explore business data without manually configuring every chart from the beginning.
Step 5: Review the Generated Visualization and Insights
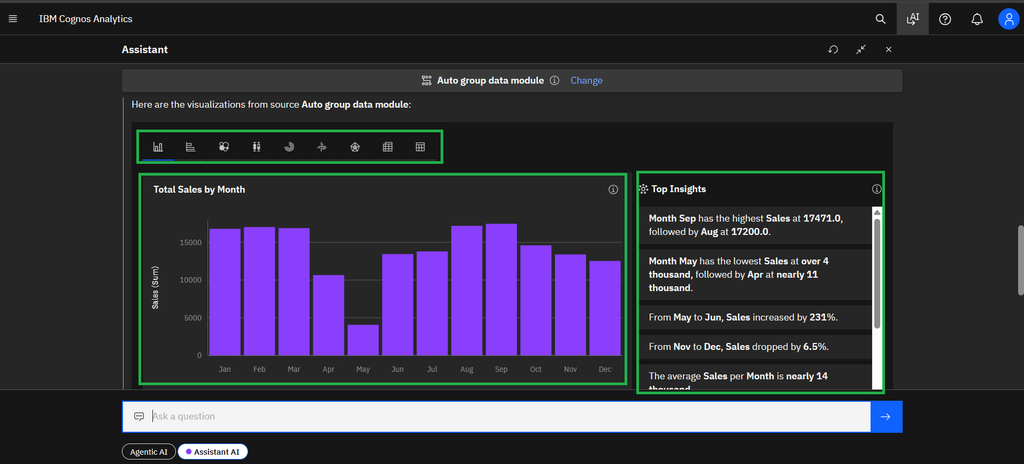
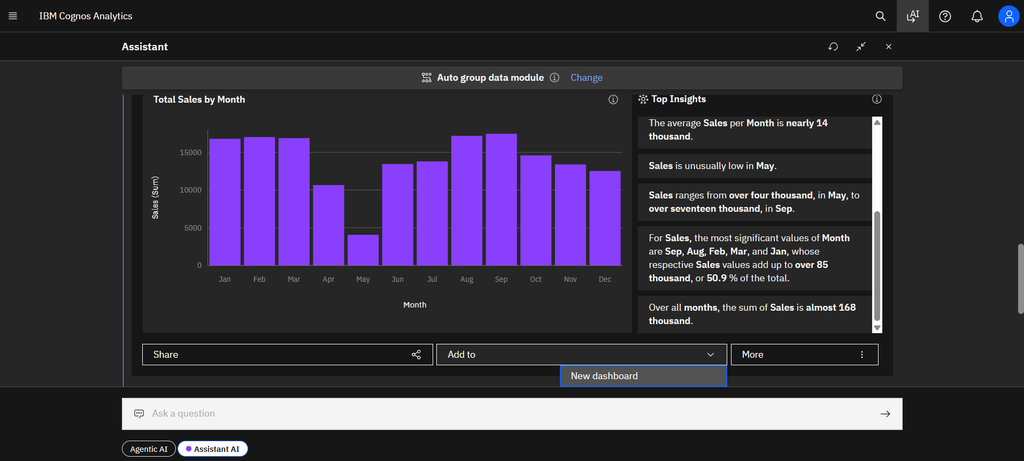
The Assistant generates a purple bar chart titled “Total Sales by Month”.
Alongside the chart, a Top Insights panel appears with automatically generated observations about the data.
For example, the insights highlight:
- September: The month with the highest sales.
- May: The month with the lowest sales.
These insights provide a quick understanding of monthly sales performance and help users identify patterns that may require further investigation.
Always verify AI-generated insights against the underlying data before using them for business decisions.
Step 6: Add the Visualization to a New Dashboard
After reviewing the chart, locate the action menu below the visualization.
Follow these steps:
- Click the Add to dropdown menu.
- Select New dashboard.
- Allow Cognos Analytics to open a new dashboard workspace.
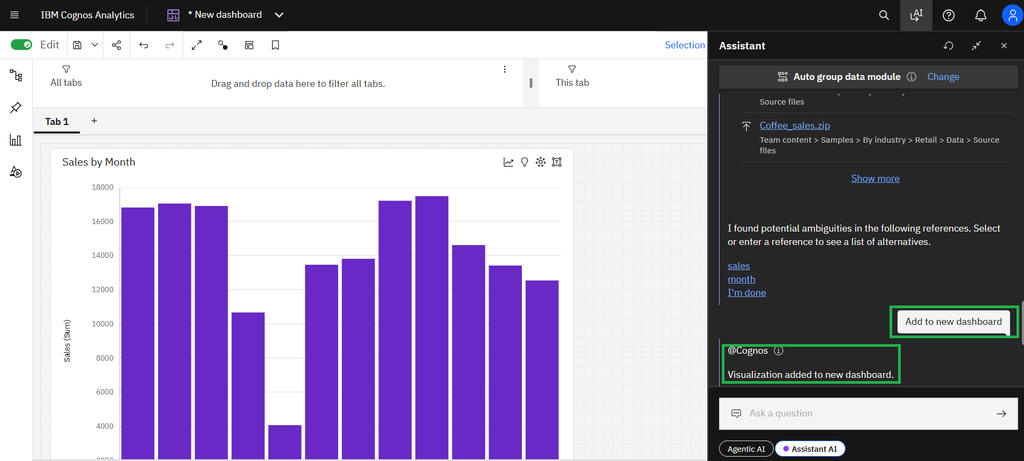
The generated visualization can now be added to a dashboard rather than remaining only in the Assistant conversation.
Step 7: Verify the Visualization on the Dashboard
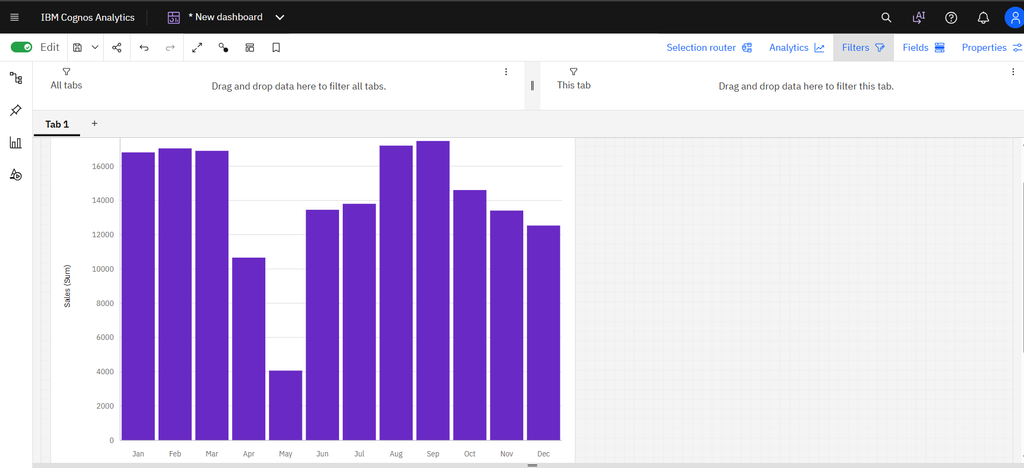
After confirming the field selections, the chart is added to Tab 1 of the dashboard workspace.
Verify that:
- The chart displays correctly.
- The title is appropriate.
- The month categories are sorted in the correct chronological order.
- Sales values are aggregated correctly.
- The chart represents the intended business question.
Once the visualization is rendered successfully, close the Assistant panel if you need more space to work with the dashboard.
You now have a dashboard containing the Sales by Month bar chart.
Step 9: Complete and Enhance the Dashboard
The initial visualization provides a starting point for further dashboard development.
Depending on the requirements and available data, you can enhance the dashboard by adding more visualizations, such as:
- Total Sales
- Total Profit
- Monthly Sales Trends
- Quantity Sold by Month
- Sales Growth Analysis
- Profitability Trends
You can also add relevant filters, adjust chart properties, refine the layout, and create additional tabs if required.
For this demonstration, the process is complete once the requested visualization has been added to the new dashboard. Any additional charts or formatting can be performed as a subsequent enhancement.
Conclusion
The AI Assistant in IBM Cognos Analytics makes it easier to move from a business question to a dashboard visualization using natural-language queries.
By selecting a data source, asking a question such as “Total Sales by Month,” reviewing the generated insights, and using the Add to → New dashboard option, users can create an initial dashboard with fewer manual steps.
This approach is particularly useful for business users who want to explore data quickly and for BI developers who want to accelerate dashboard development.