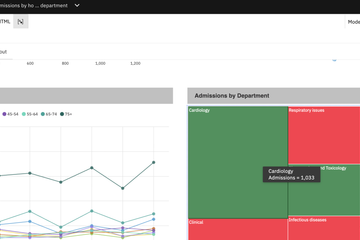
In business intelligence, dashboards help users monitor KPIs, identify trends, and make data-driven decisions. However, sometimes a high-level summary is not enough. Users need to explore specific data points and understand the details behind them.
IBM Cognos Analytics 12.1 provides drill-through functionality that allows users to navigate from one dashboard to another while passing the selected data as filters. This creates a more interactive and connected analytical experience.
Follow these steps to configure a drill-through definition between dashboards:
Open the source dashboard: Select the visualization from which users should navigate to another dashboard.
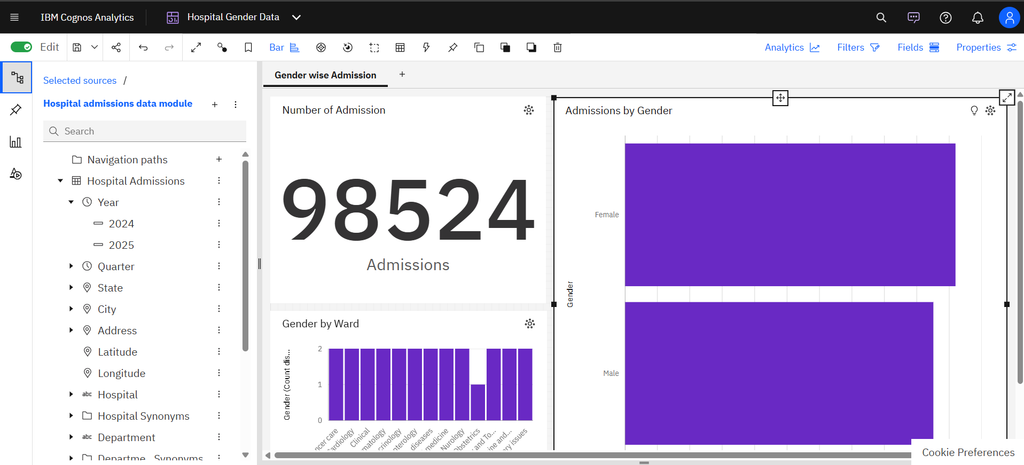
Access the Drill-through option: Click the Drill-through icon in the visualization toolbar
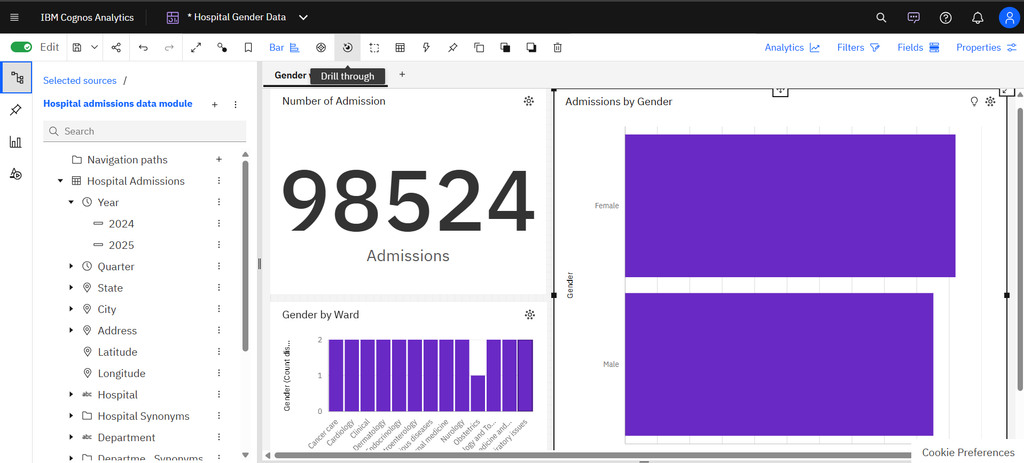
Add a definition: Select Add a new drill-through definition. If the option is unavailable, switch to edit mode.
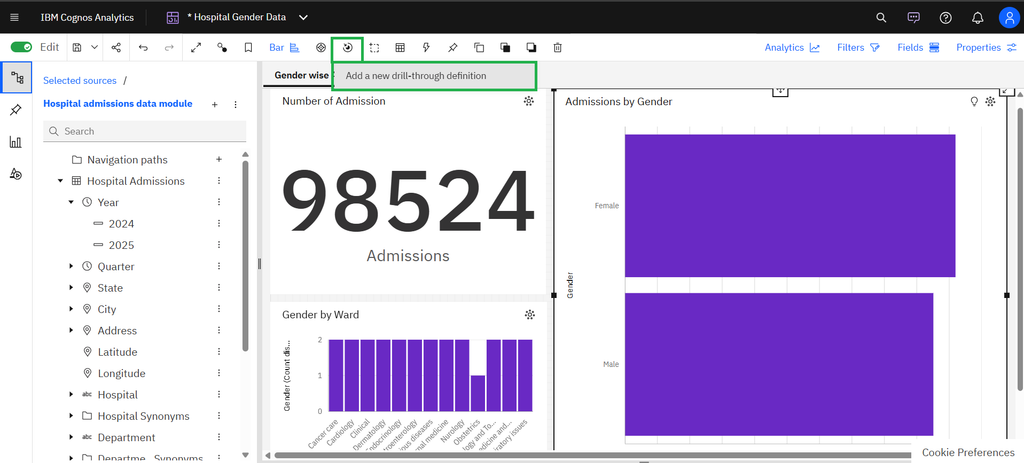
Select the Target Report: Browse the Team content folder and select the report you want to open. Once the report is selected, map the report parameter to the source visualization field that will be used for drill-through.This ensures that the selected value is passed as a parameter to the target report, allowing users to view filtered and relevant details.
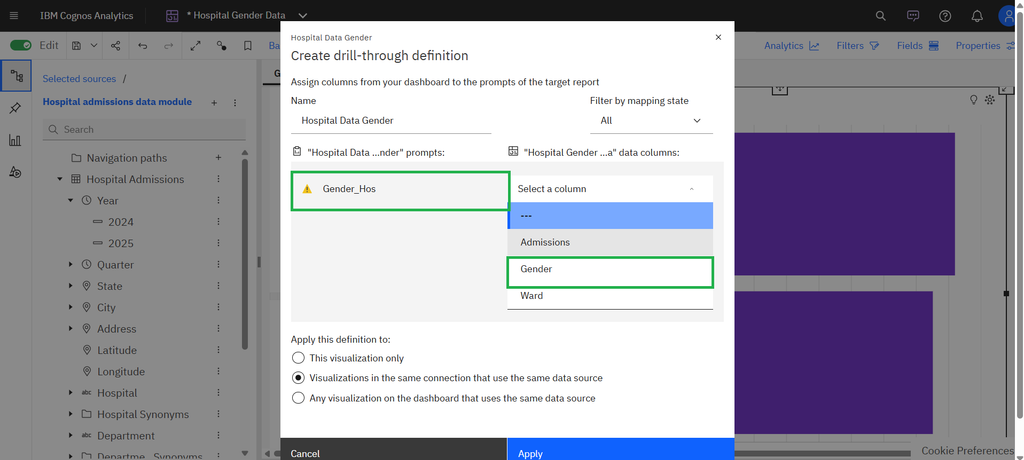
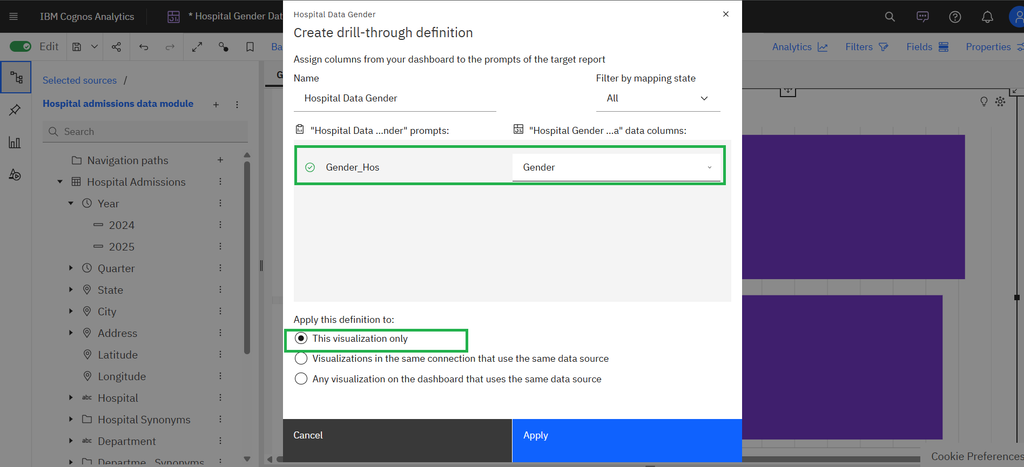
Configure the scope: If required, select the checkbox to apply the drill-through definition to all visualizations in the dashboard or story that use the same data source in the same connection
Save and test: Return to the source dashboard and test the drill-through using one or more data points.
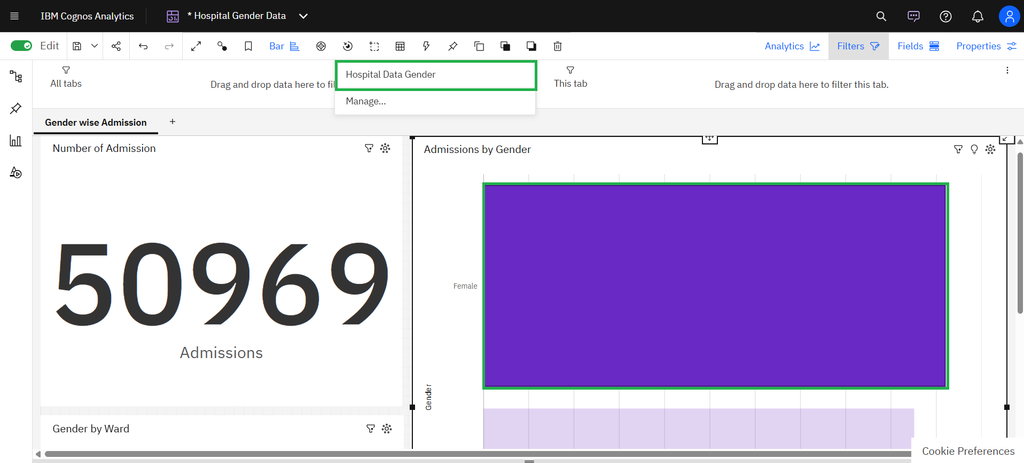
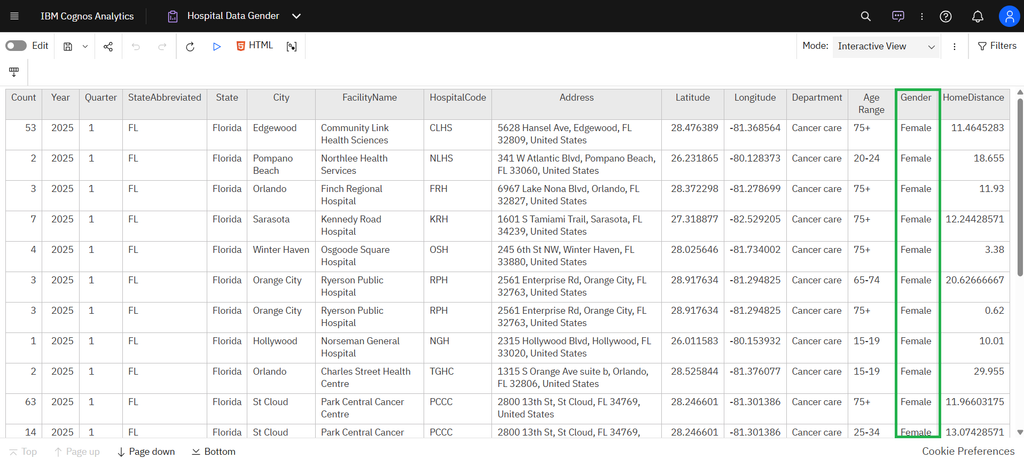
Filter Data: Based on the selected category, the target dashboard or report filters the data using the passed parameter and displays the relevant results for further analysis.
Conclusion
Drill-through in IBM Cognos Analytics 12.1 helps users move from one dashboard to a detailed report by passing selected values as parameters. By mapping the source visualization field to the target report parameter, developers can ensure that users see relevant, filtered data for deeper analysis.
This feature improves dashboard interactivity, simplifies data exploration, and enables faster, data-driven decision-making.