With the release of Cognos Analytics 12.1.0, IBM introduced the Interactive Brushing capability, enabling users to select and highlight data points within reports. In newer 12.1.1 version, this capability has been significantly enhanced. Report authors now have full control to configure and customize interactive behaviors directly within the report, with interactions defined at the individual object level. This provides greater flexibility in how each object responds to user input.
Interactive brushing allows user to highlight data items within a single data container and with latest version, it is now supported across 11.1 visualizations. Within these visualizations and data tables, highlighting can be combined with filters to further amplify the visibility of selected data points.
By enabling users to interact with data dynamically, Interactive Brushing transforms reports from static visualizations into insight-driven experiences that adapt instantly to user actions.

Interactive Brushing in Cognos 12.1.1
Two types of interactions offered by Interactive Brushing are:
- Highlight: Clicking a data item highlights related data across all connected objects in the report. Unrelated items become semi-transparent, helping users clearly visualize relationships and patterns.
- Filter: Clicking a data item dynamically filters related objects, such as visualizations, lists, or crosstabs, to show only the relevant data, allowing users to focus on what matters most.
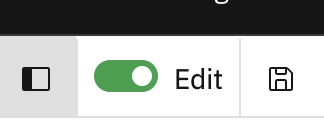
- We can configure this interactive brushing with advanced capabilities in a report in edit mode, when the Edit toggle is turned on.
- We can define parameters, parameter values, conditions, and connections between data containers by clicking the Interactive Behavior button for the data container of our interest.
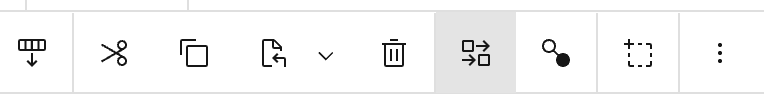
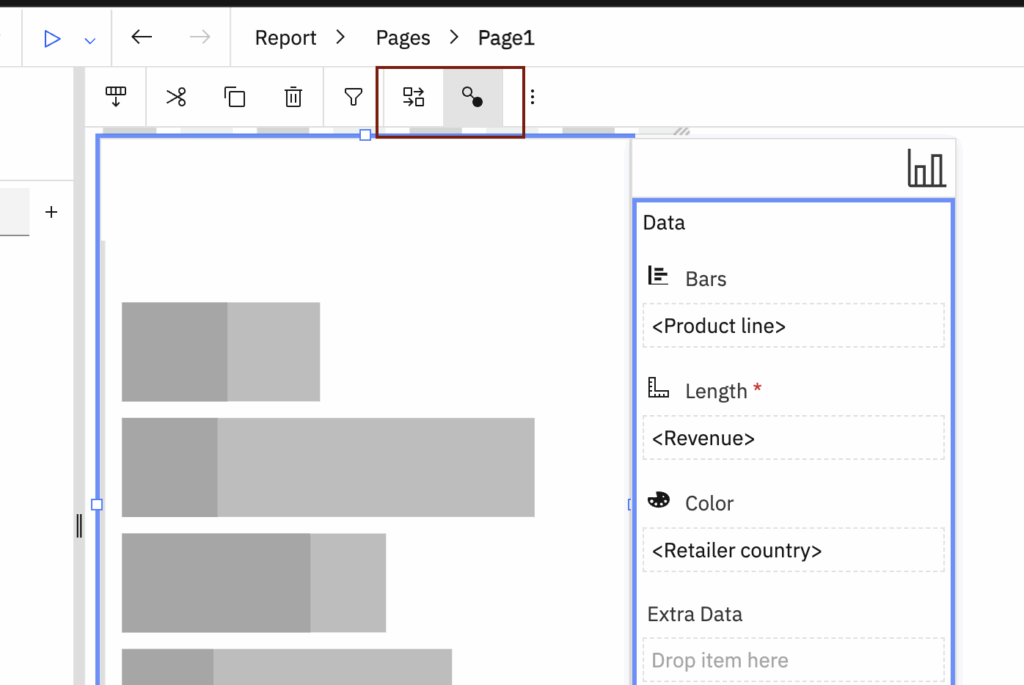
- Clicking the Interactive Behavior icon in the on-demand toolbar opens the Interactive Behavior window
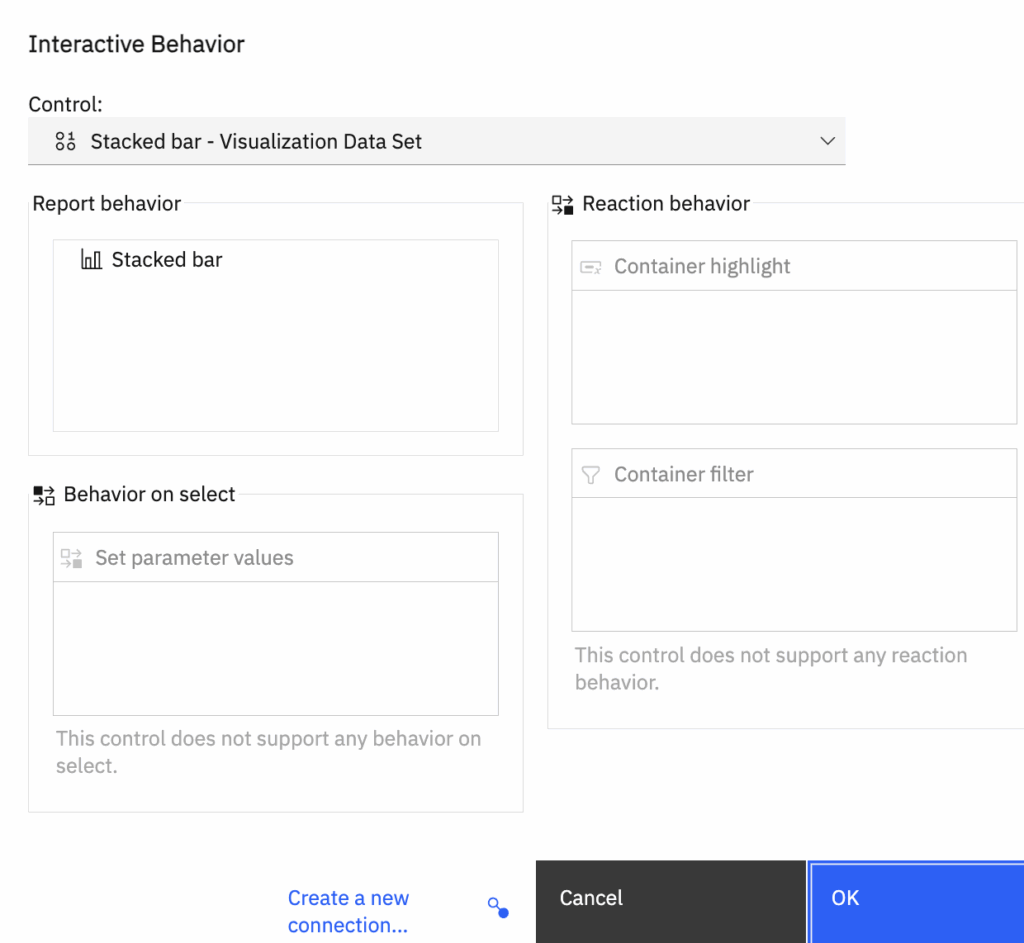
- Open ‘Create a new connection’ window either by clicking the Create a new connection icon in the toolbar or from Interactive Behaviour pop up window.
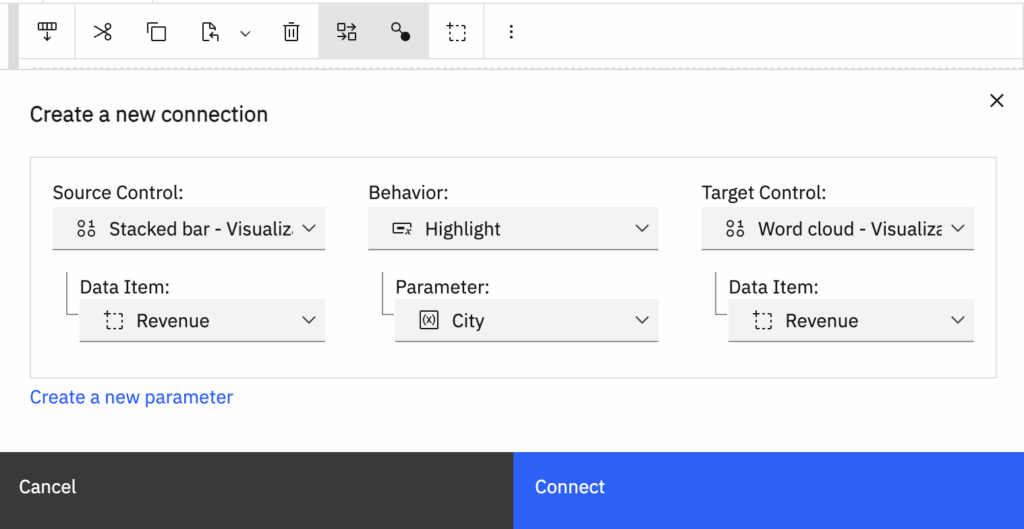
- It allows user to set the source and target controls (Visualizations & data table) and define the behaviour whether to highlight the data point or apply filter in target control.
- With Highlight Behaviour
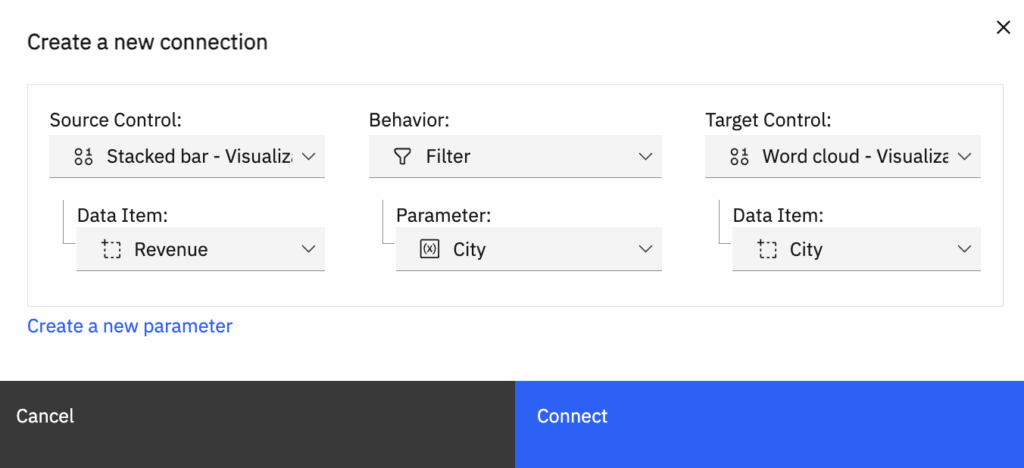
- With Filter Behaviour
- Note: We can apply filters only in data tables and 11.1. visualizations
- With Highlight Behaviour
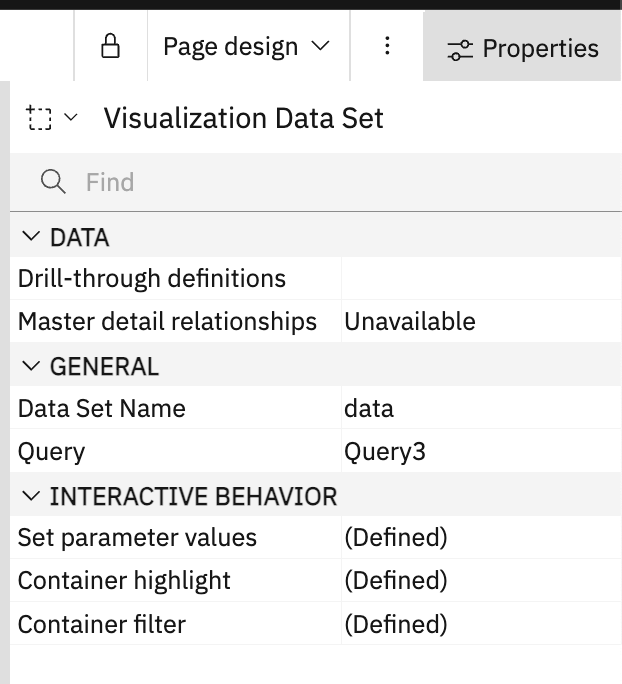
Once all the behaviours are set, we can open the Interactive Behaviour again to confirm the settings configured.
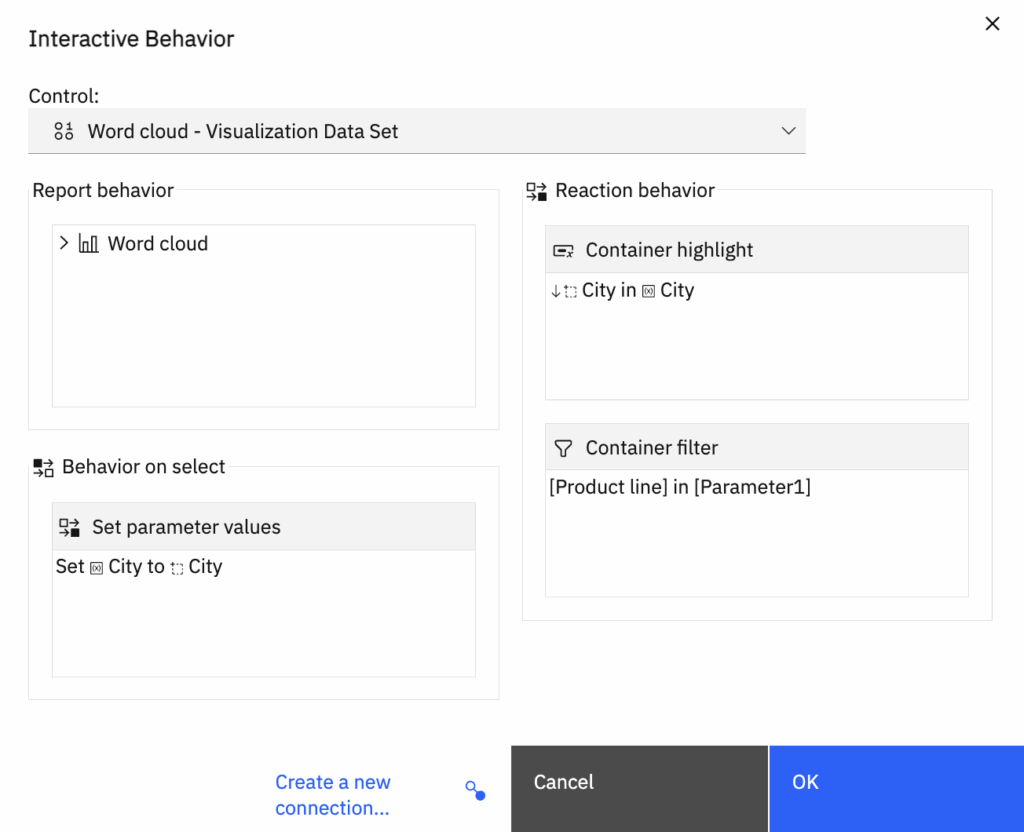
We can also set/check the same from Visualization’s property as well
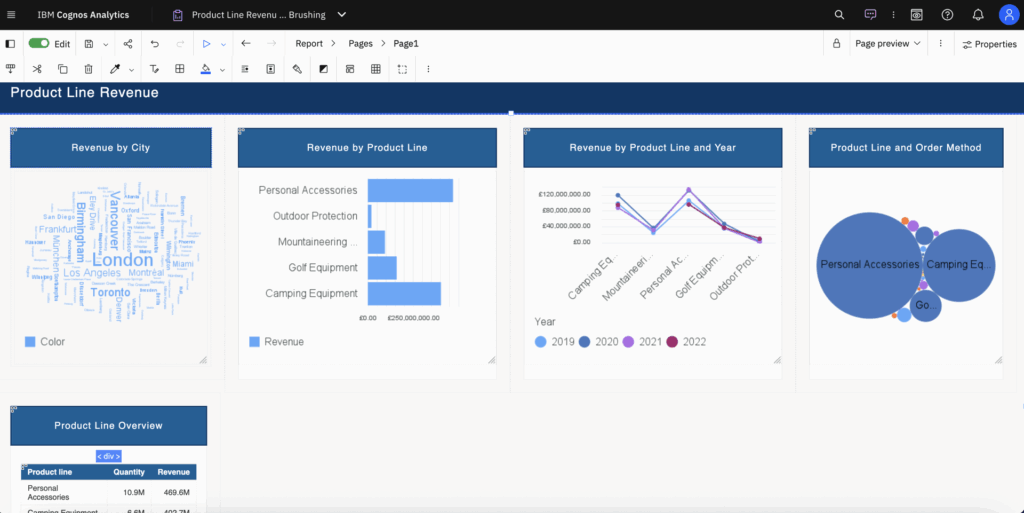
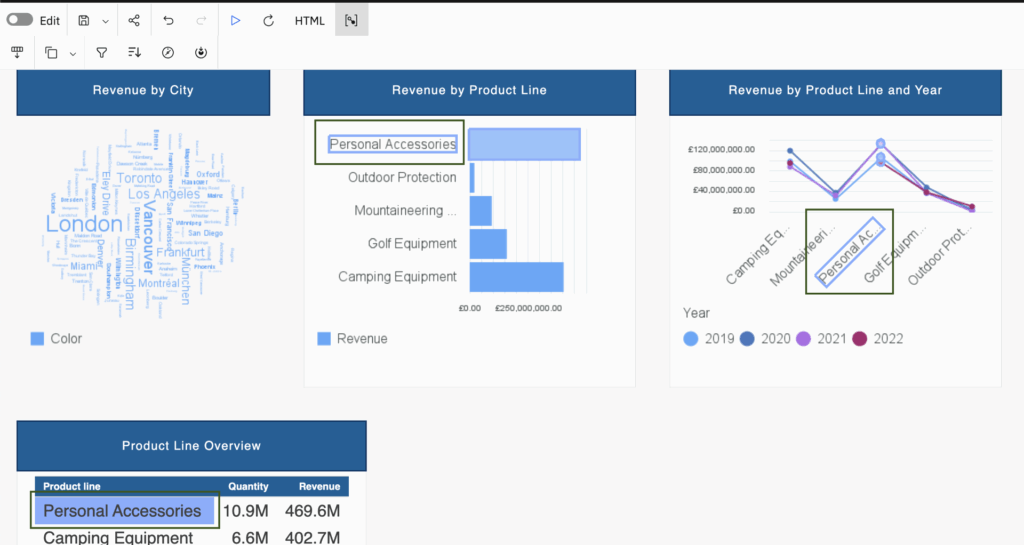
Now save and run the report and select the data points in visualisations or list data in output.
Selecting one data point will highlight/filter the data in related visualisations.
Note: With Cognos 12.1.1, we don’t need to enable/disable Interactive Behaviour in output window if it has only 11.1 visualizations in it. It works automatically as we have configured it within the report itself.
However, if we have 11.0 or old visualizations in report too and they are not configured with 11.1 visualizations, then we have to enable/disable Interactive Behaviour button.
Current issues identified in Cognos 12.1.1
Once we select the data point in stacked bar chart and reset it (either using the reset button or re-selecting the same data point with ctrl), chart bar do not returns to the default bar colour (blue) instead they appears with fade blue colour (see above gif image for same).
Interactive Brushing with Cognos 12.1.0
Now lets see what Cognos initially offered with earlier Cognos Analytics 12.1.0 version:
- It offered limited brushing (select and highlight only) to data points in multiple data containers in interactive reports.
- To use Interactive behaviour, we had to enable/disable the Interactive behaviour icon in output window.
- Interactive brushing was limited to containers, such as lists, crosstabs, repeaterTables, charts & 11.0 visualizations only. 11.1 visualization were not working in it.
Use of Interactive Brushing:
Apply the interactive brushing when you view or run a report in the HTML format, as an author or consumer, with the Run with full interactivity property turned on.
If report is opened in Edit mode, Interactive feature will not appear
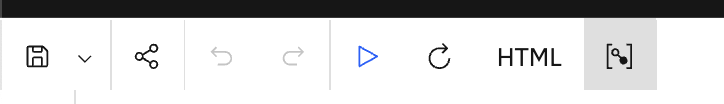
Once Edit mode is turned off, Interactive feature will appear in toolbar (highlighted in red box)
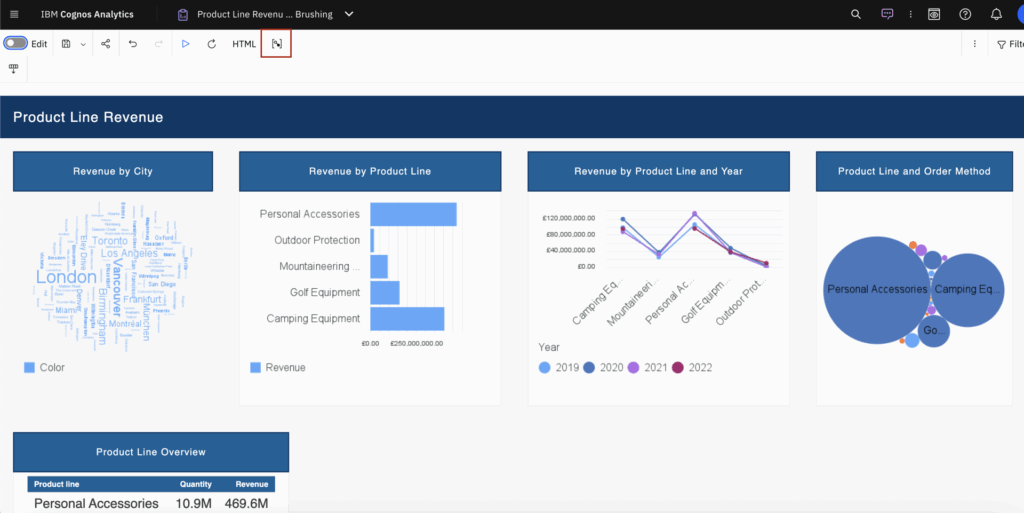
Click Interactive Brushing icon to enable it.
Now click on any data point and you will see that related data points in other widgets will be highlighted automatically.
Note: To make more than one selection, hold Ctrl and click all data points of your interest.
Enable/Disable Interactive Brushing in Cognos Admin Portal
Note: Applicable 12.1.0 onwards
Interactive brushing for reporting can be enabled or disabled through feature customization for user roles and groups by following these steps:
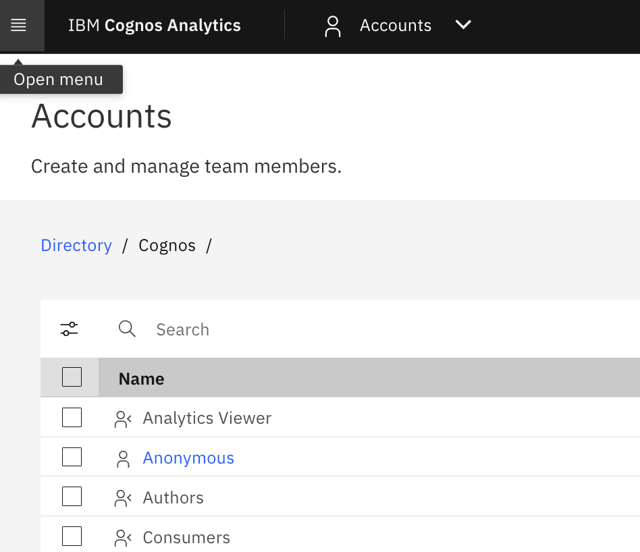
- Go to Manage > People > Accounts.
- Click the Cognos namespace.
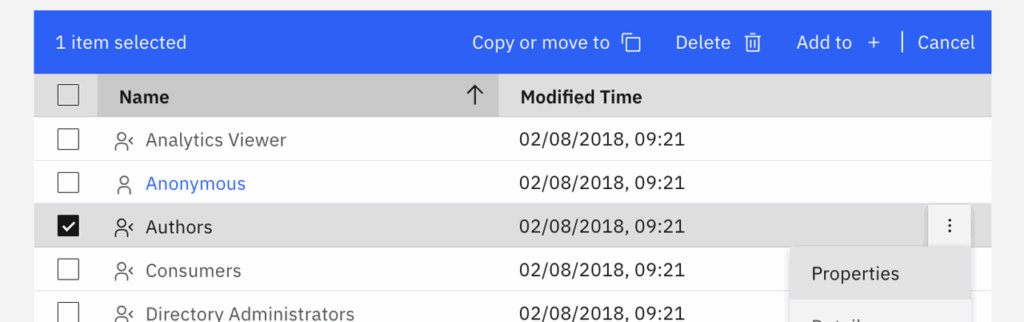
- Find the role that you want to customize, for example Authors, and click the Menu icon next to its name.
- Click Properties.
- In the Properties page, go to the Customization tab.
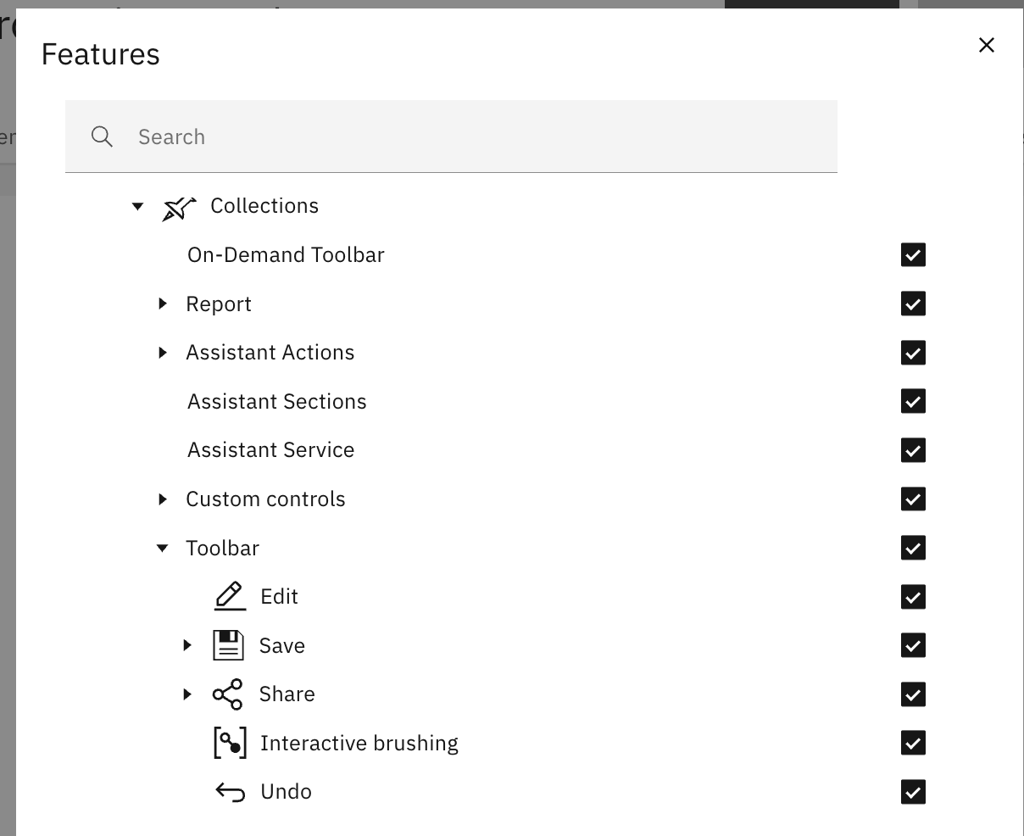
- For Features, click the Edit icon.
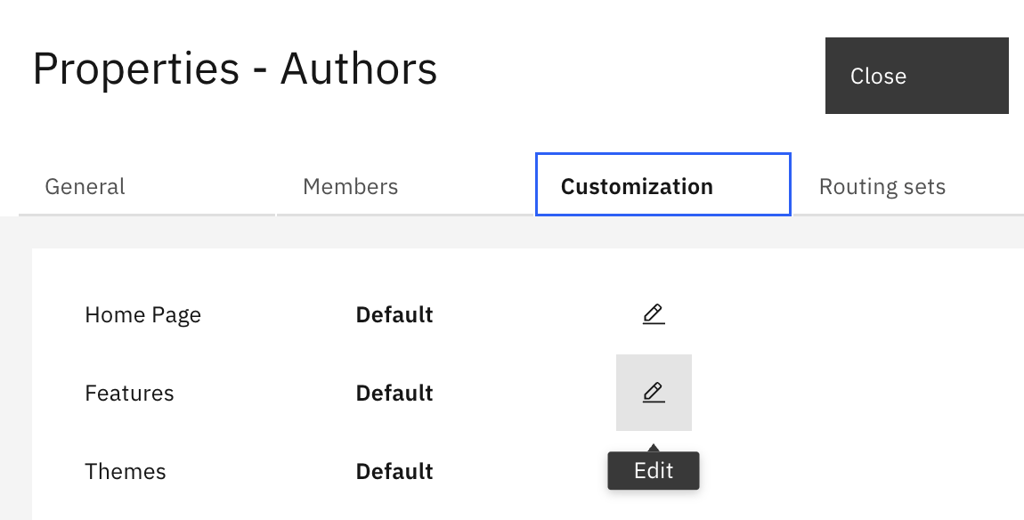
- In the Features dialog box, click Reporting > Collections > Toolbar, and clear or select the Interactive brushing checkbox.