In collaborative data environments, numbers alone rarely tell the full story. Dashboards may reveal sudden spikes, unexpected drops, or emerging trends without explaining the underlying business or operational causes.
To bridge this gap, IBM Cognos Analytics provides a built-in feature called Content Notes, which enables teams to document insights, share observations, and capture important decisions directly within dashboard visualizations.
Content notes help preserve valuable context alongside the data, making dashboards more informative, collaborative, and easier to interpret.
This step-by-step guide explains how to add, manage, search, and control the visibility of content notes in IBM Cognos Analytics dashboards.
Step 1: Open the Content Notes Section
Content notes are available in supported versions of IBM Cognos Analytics, although their availability and behavior may vary depending on the version and dashboard configuration.
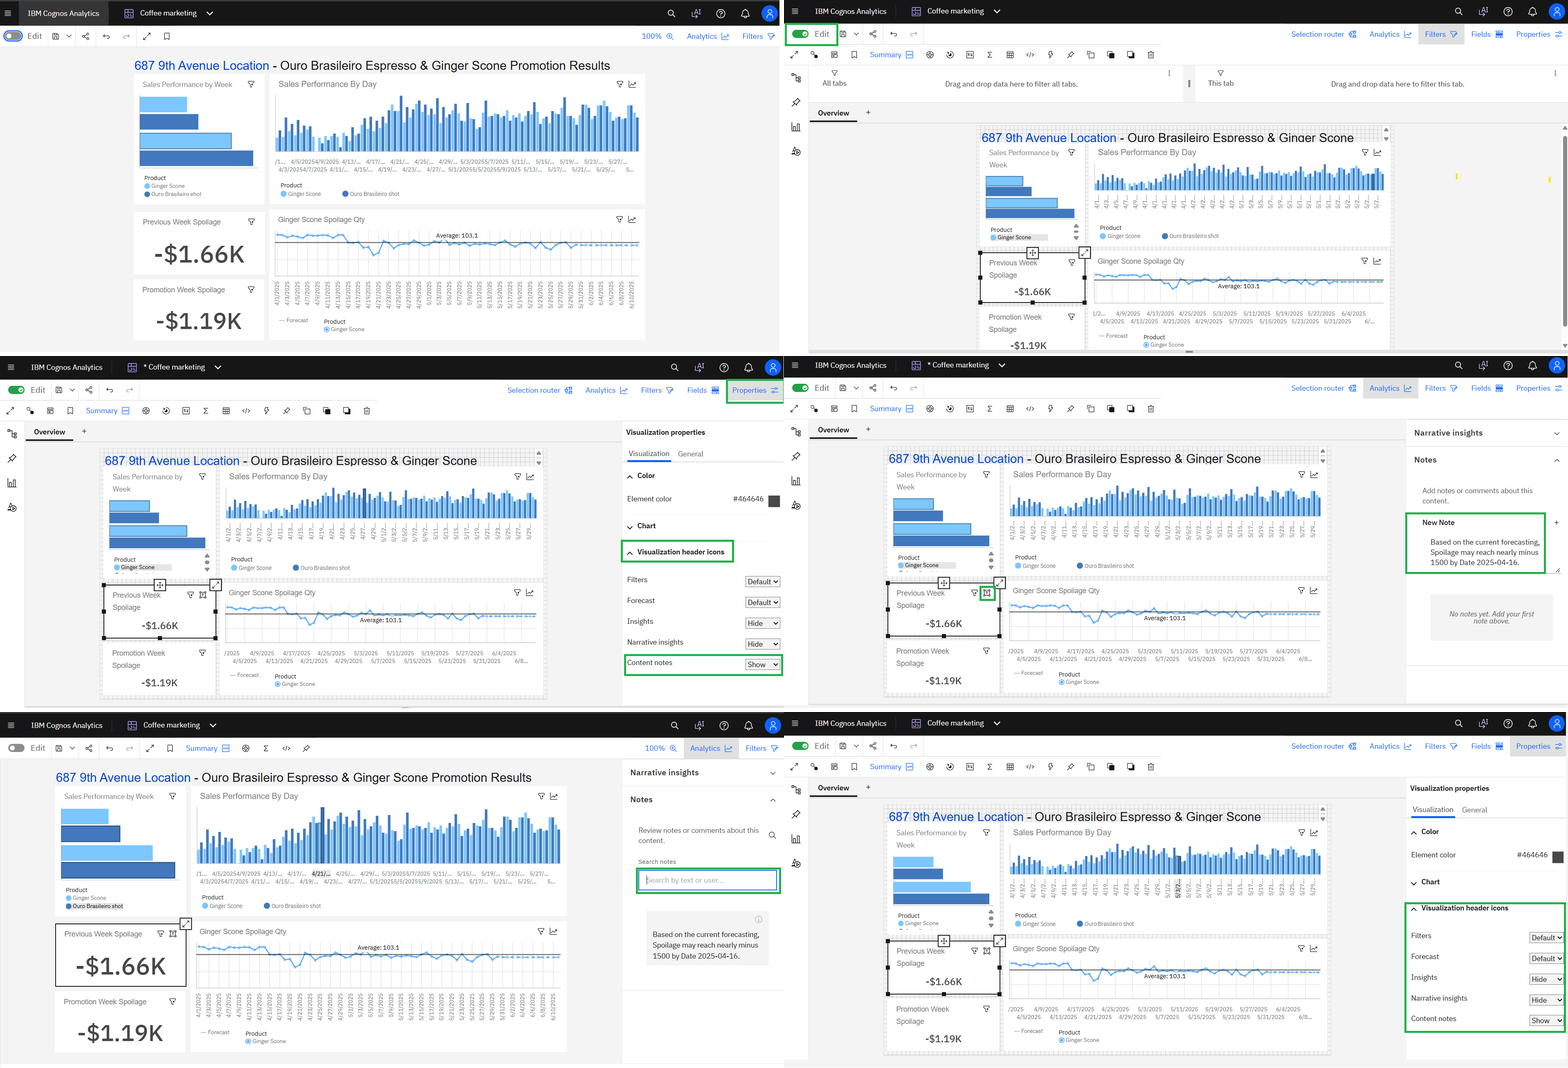
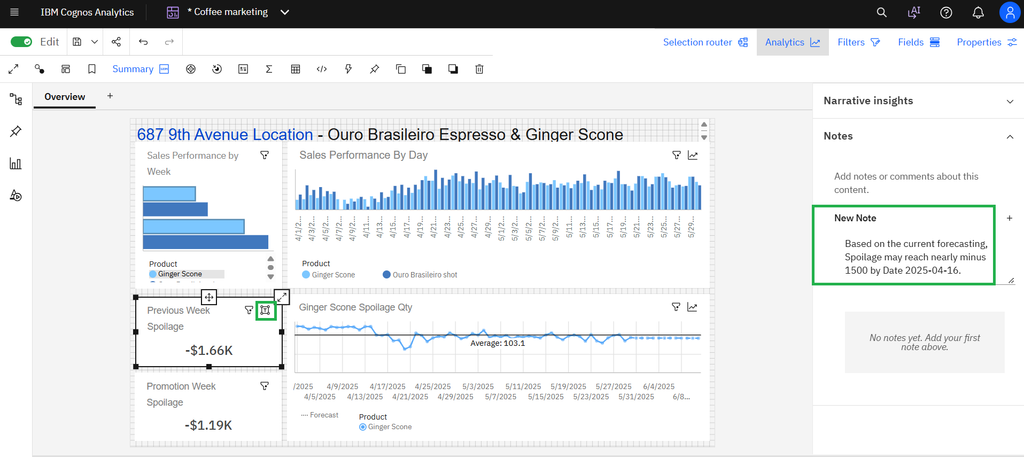
Click the Notes icon. The Analytics side panel opens and displays the Notes section for the selected visualization.
Open your target dashboard in Edit or View mode.
Locate the chart or visualization you want to annotate.
Hover over the visualization, if necessary, to display its header icons.
Step 2: Add a New Note
Once the Notes panel is open, you can document your observations or provide additional context for the selected visualization.
- Click New Note (+) in the Notes panel.
- Enter your observation, explanation of the underlying cause, business context, or relevant decision.
- Save the note if prompted.
Note: Depending on your Cognos Analytics version, notes may be saved automatically or require an explicit save action. Author information and timestamps may also be recorded according to the platform’s behavior.
Step 3: Search, Review, and Edit Notes
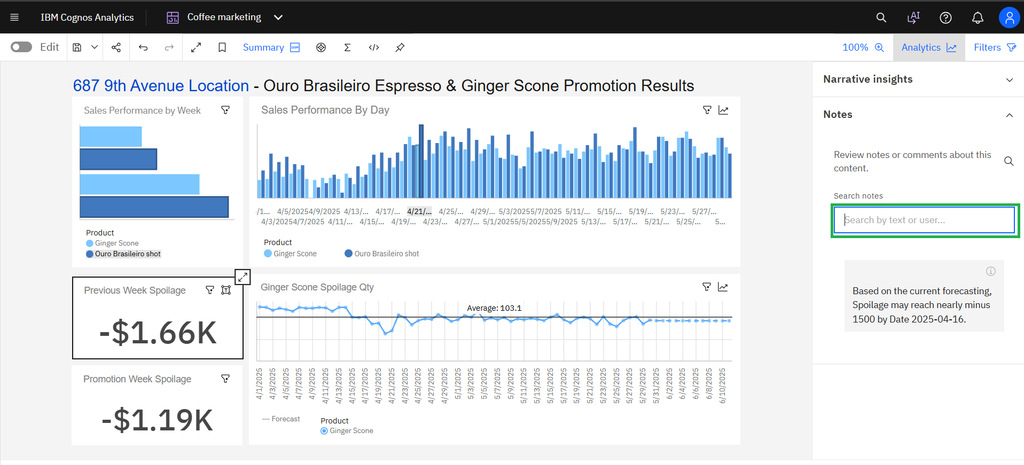
As your team adds more notes, use the available Notes panel features to keep information organized and accessible.
- Search: Use the panel’s search functionality, if available, to locate notes by keywords or author.
- Review: Read existing notes to understand the context behind data changes, trends, or business decisions.
- Edit: Update your own notes when new information becomes available or previous conclusions need revision.
Keeping notes accurate and up to date helps teams maintain a reliable record of analytical observations and decisions.
Step 4: Configure Content Notes Visibility
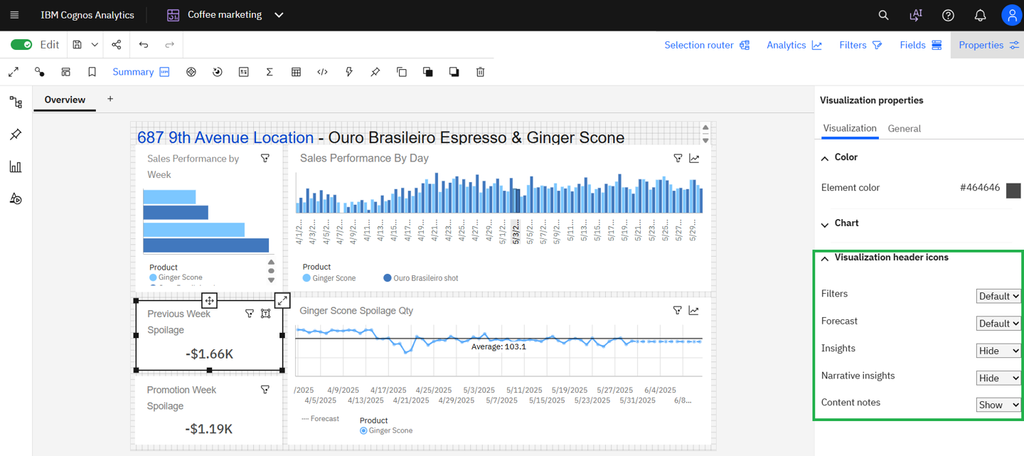
You can control the visibility of content note icons to maintain a clean dashboard layout, particularly when preparing dashboards for executive presentations.
To adjust the visibility settings:
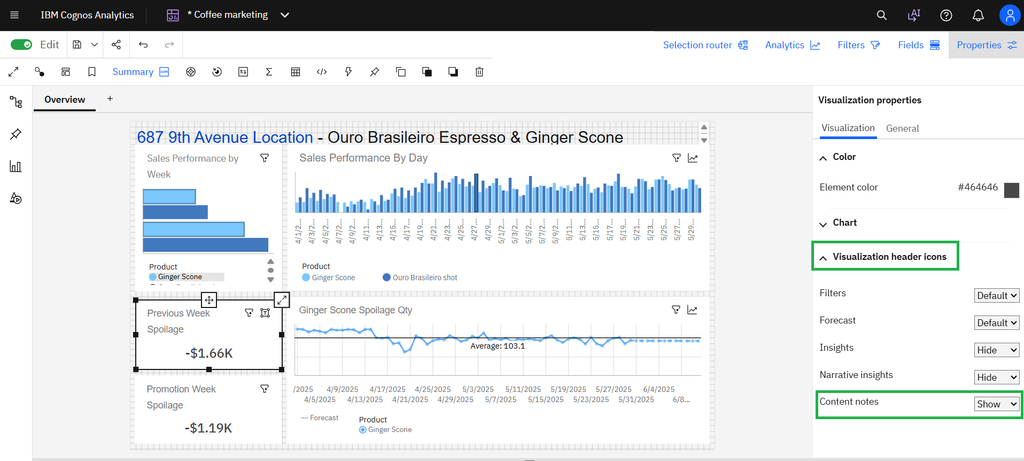
- Open the dashboard’s Properties panel.
- Locate the Visualization header icons drop-down menu.
- Find the Hide content notes option.
- Adjust the setting according to your dashboard’s presentation requirements.
The availability and scope of this setting may vary by Cognos Analytics version and dashboard configuration. Verify the result in the dashboard to ensure the notes icons appear or remain hidden as intended.
Conclusion
Content notes transform dashboards from static collections of metrics into collaborative spaces for sharing insights and preserving business knowledge. By documenting observations, explaining unexpected changes, and recording relevant decisions alongside visualizations, teams can better understand not only what the data shows but also why it matters.
By adding, reviewing, and managing content notes effectively, organizations can improve collaboration, preserve institutional knowledge, and support more informed, data-driven decisions.