IBM Cognos Analytics 12.1.x allows report developers to apply conditional colors to visualizations based on data values. Using Conditional Palette, you can automatically highlight specific data points with different colors depending on numeric ranges, dates, or string-based conditions.
This makes reports easier to understand and helps users quickly identify important metrics, exceptions, and trends without manually formatting individual data points.
Open existing report or create a new report in Cognos Analytics.
Select an 11.1 visualization where we want to apply conditional palette.
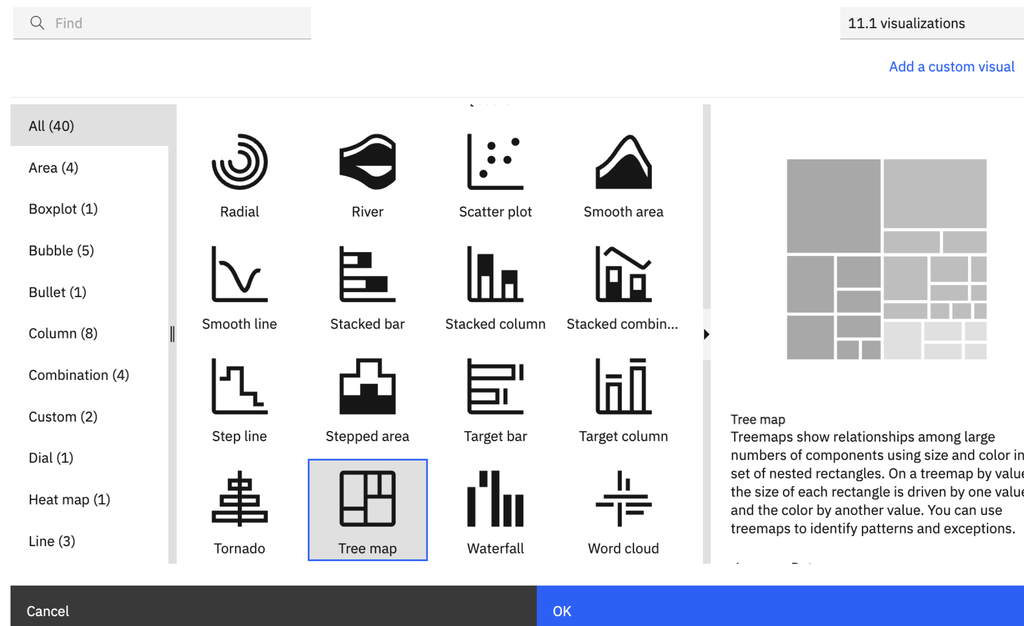
Note: Currently, only below type of visualizations are supported:
- Bullet – both color and patterns are available as a fill
- Dual-axis column – both color and patters are available as a fill
- Dual-axis line – only colors are available as a fill
- Donut – both color and patters are available as a fill
- Treemap – both color and patterns are available as a fill.
Open the Visualization Data pane.
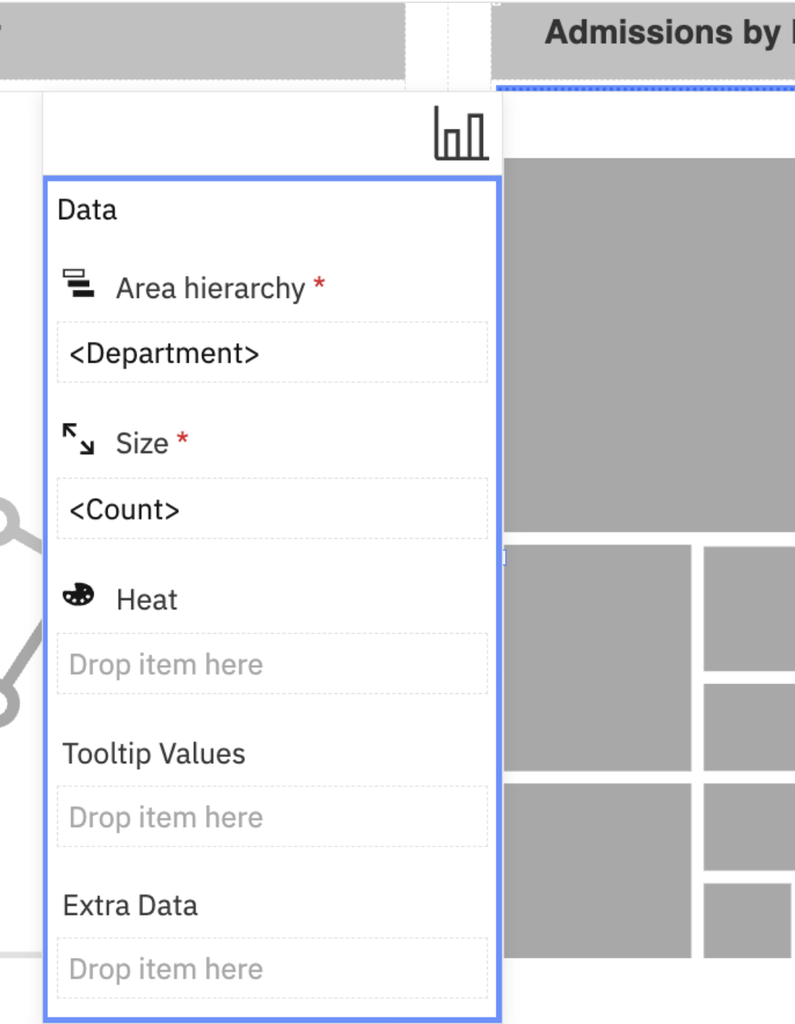
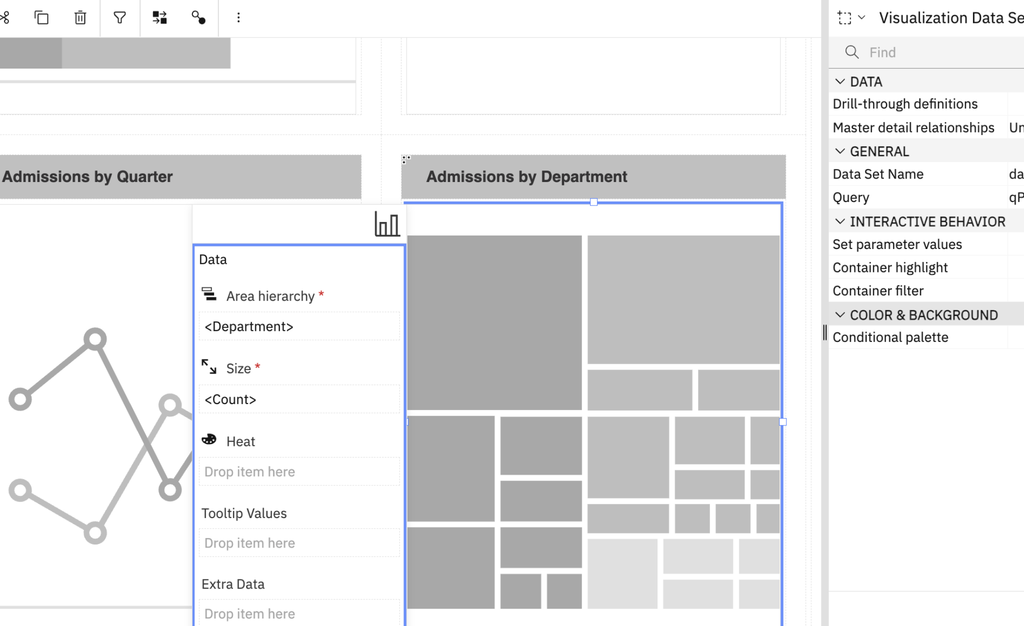
Now, we can access the Conditional Palette window in either of the following ways:
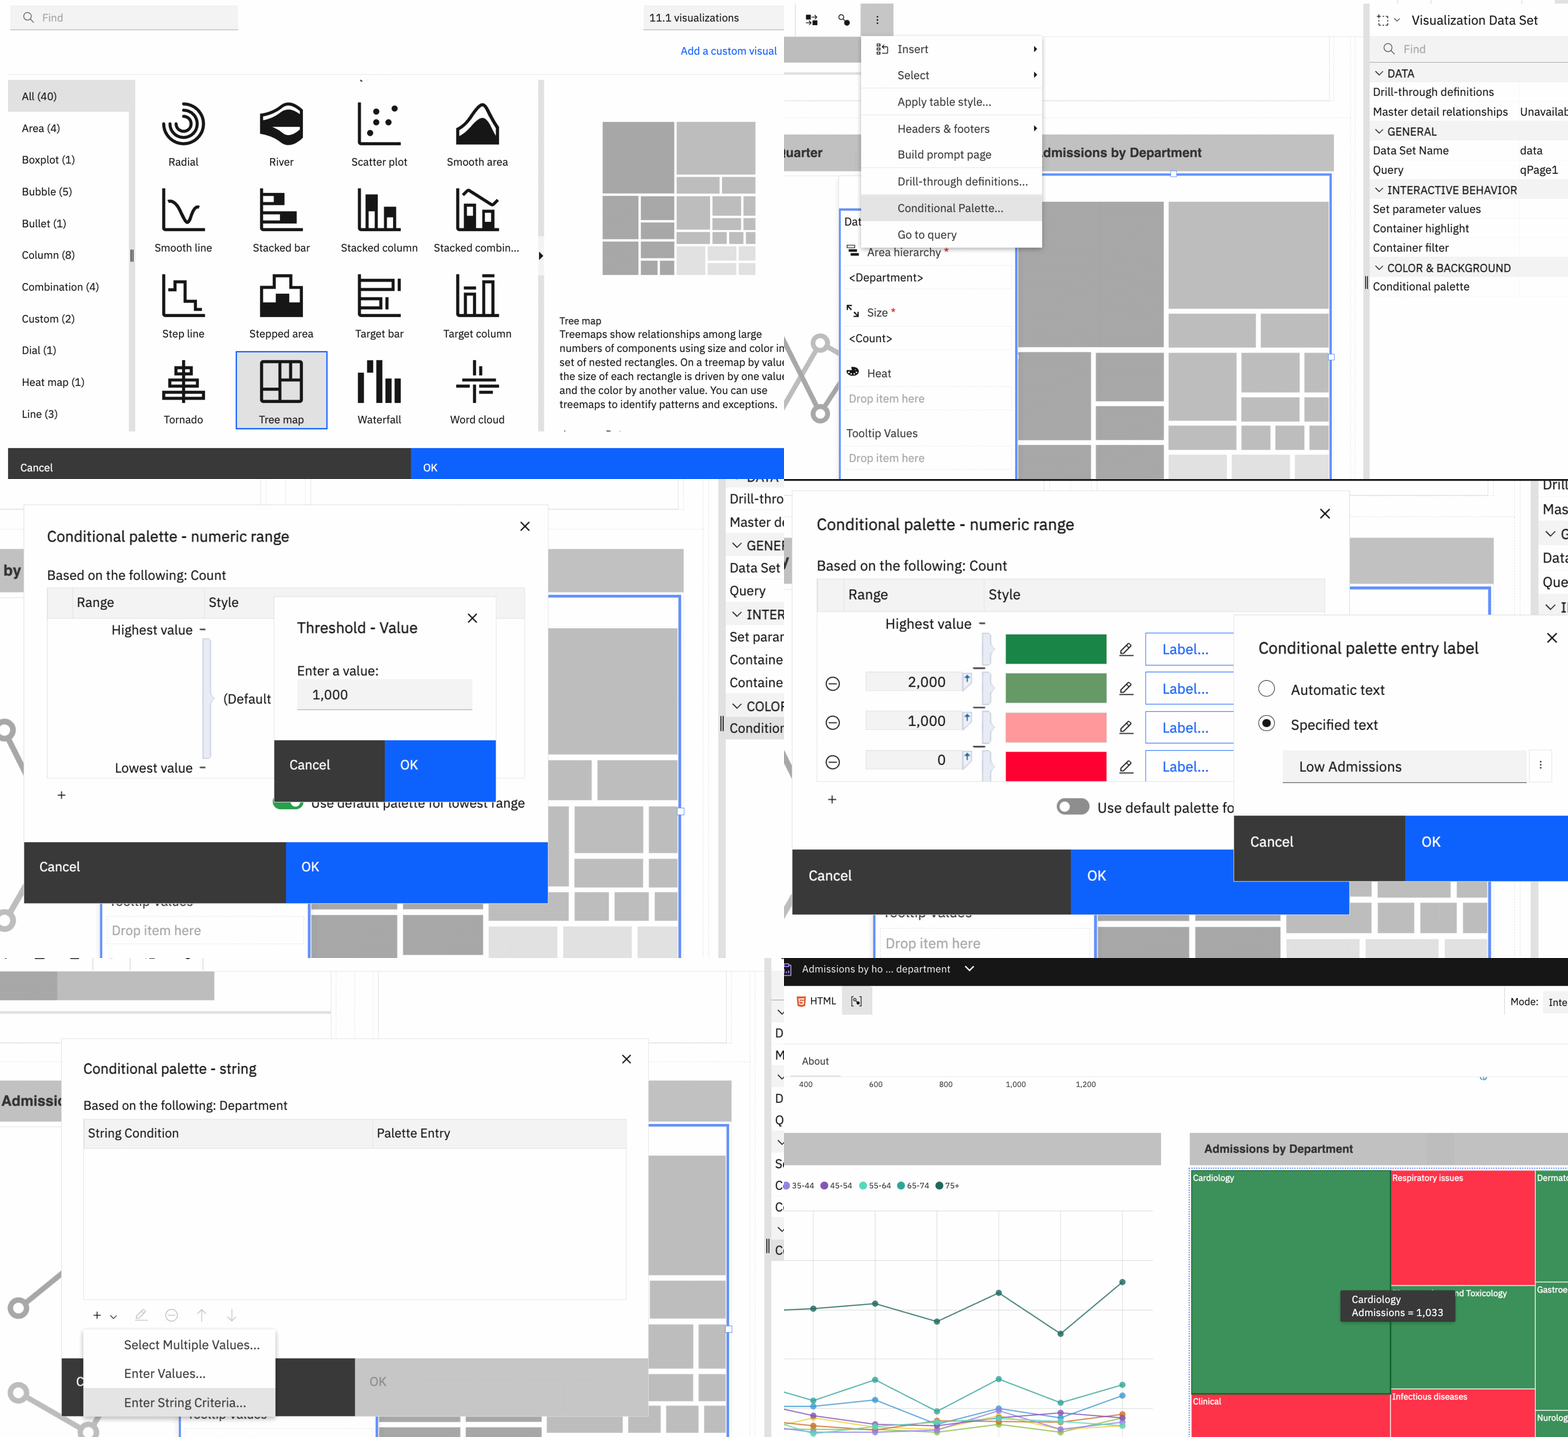
- From the Properties pane, navigate to Color & Background → Conditional palette and click the More icon.
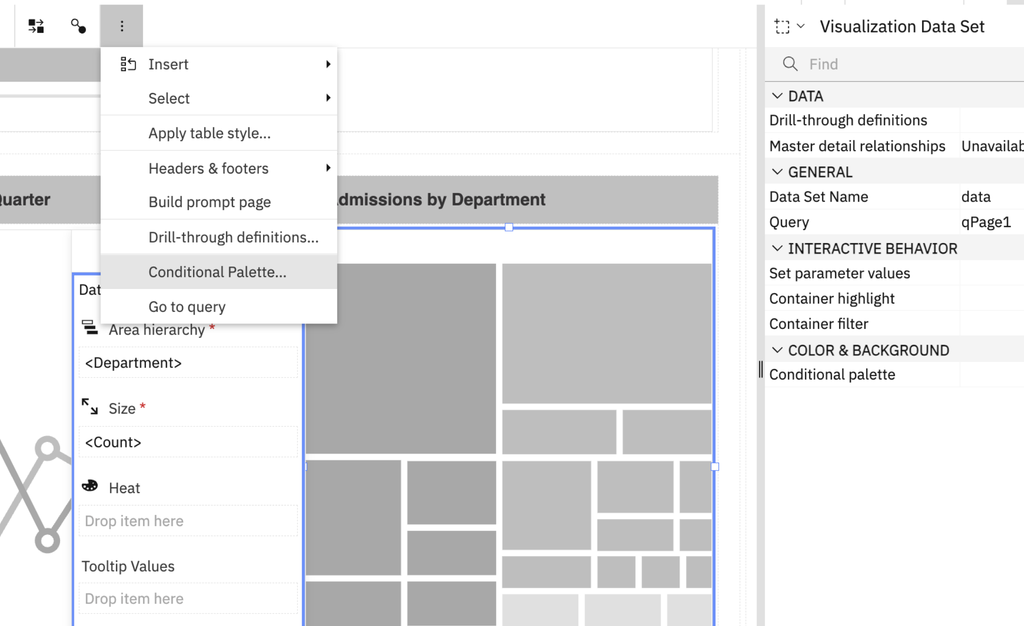
- Alternatively, use the visualization’s on-demand toolbar, click the More icon, and select Conditional palette.
In the Conditional Palette window, click the New Conditional Palette Entry (+) icon.
The New Condition window will appear.
To define conditions, lets use numeric conditions to highlight values based on thresholds.
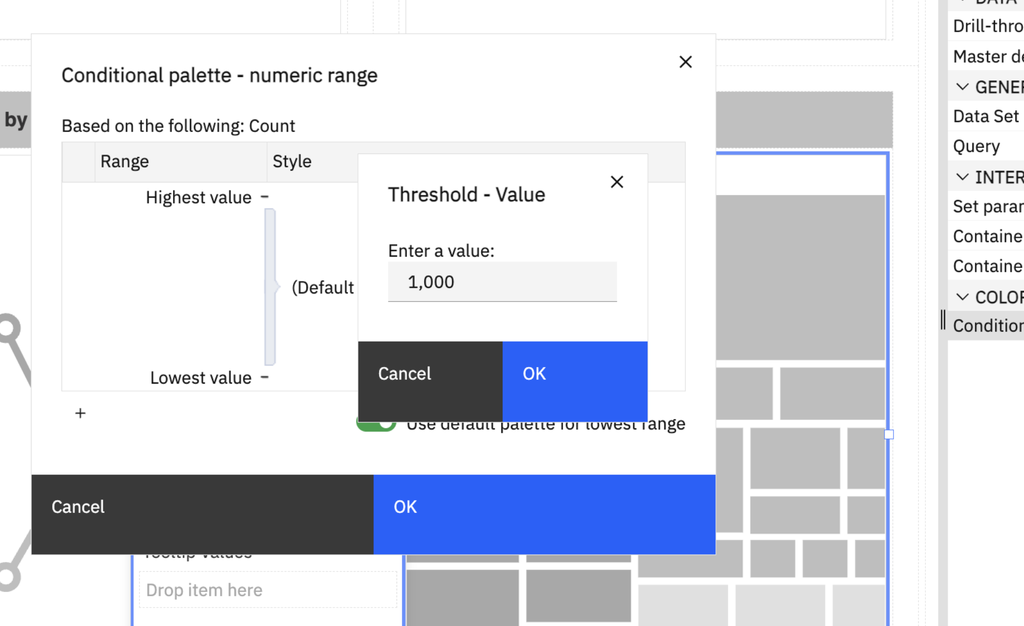
Add a numeric threshold and configure the required range and colors.
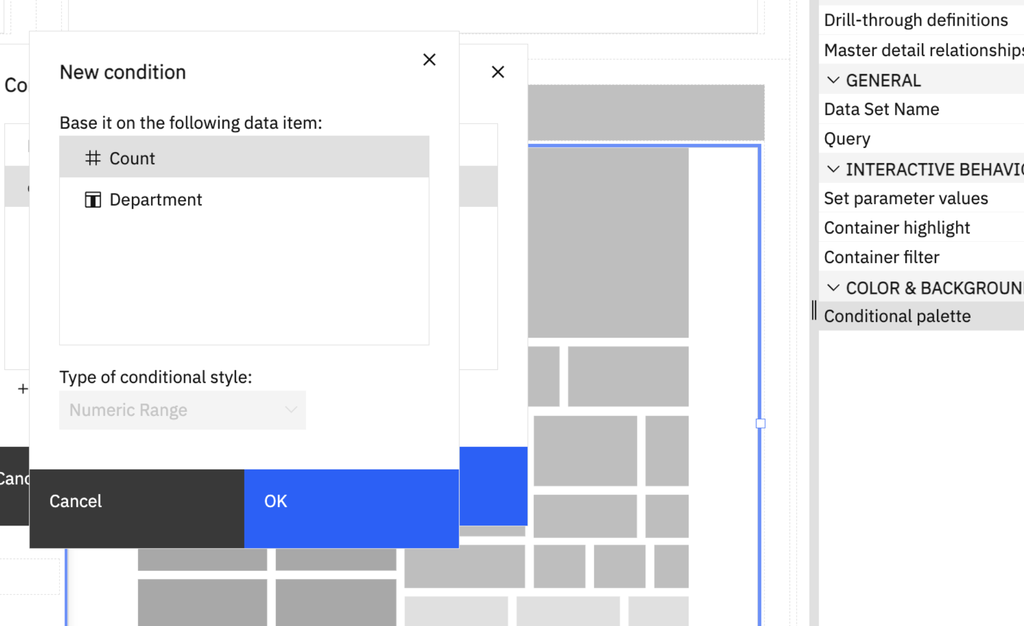
Create a conditional palette for admission count.
If needed, we can set a range for admission count.
We can assign label names as well to these palette entries.
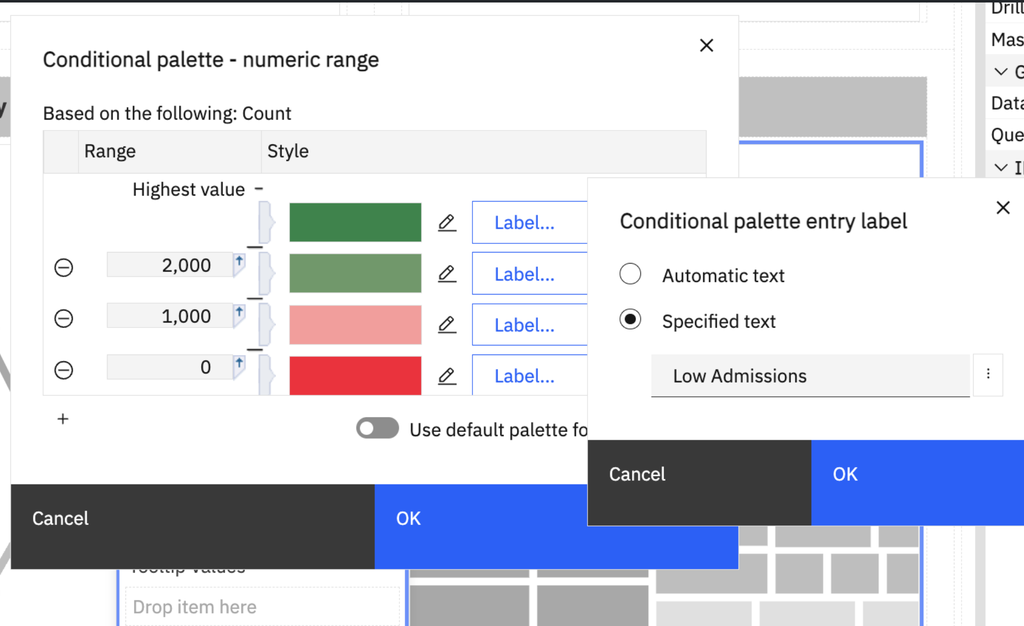
Click Ok to return to previous window
String-Based Conditions: Use string conditions to apply colors based on specific text values or criteria.
Now create a Department name based conditional palette too.
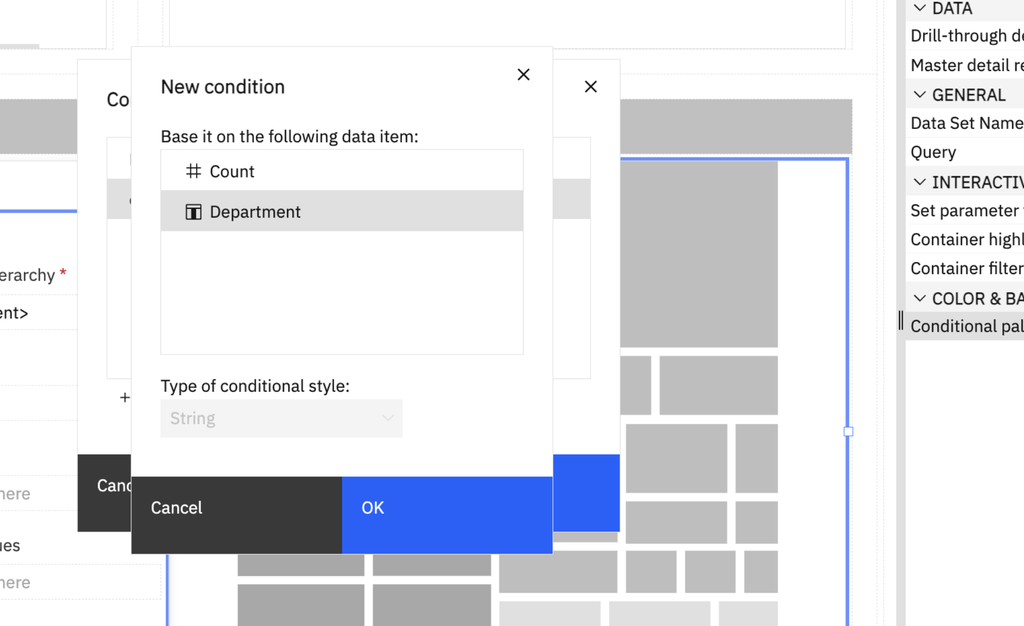
Select String criteria for Department name.
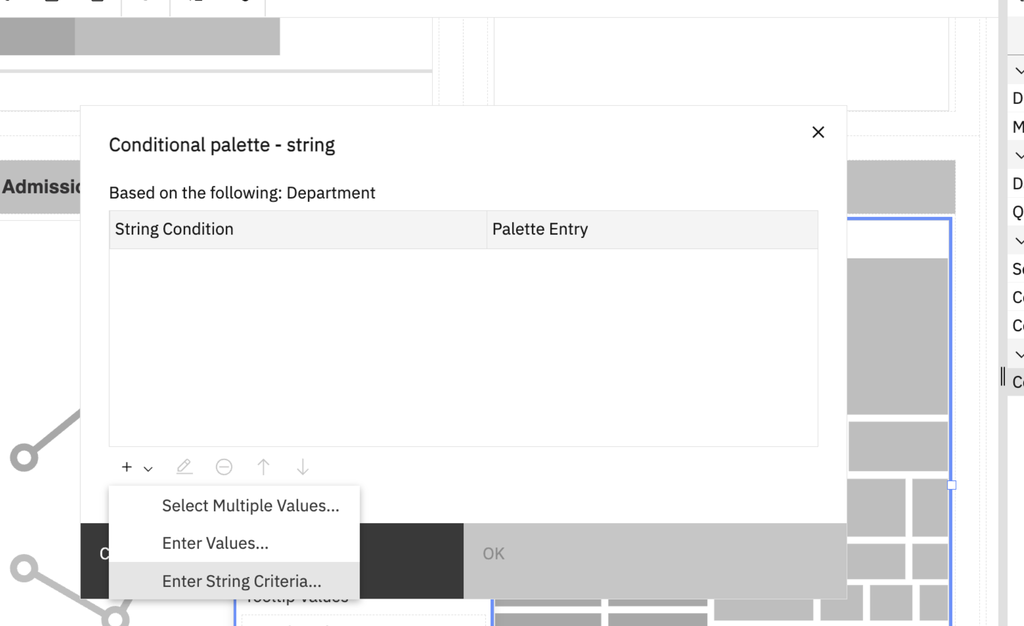
And set condition for any department name containing ‘logy’ in name will appear in green.
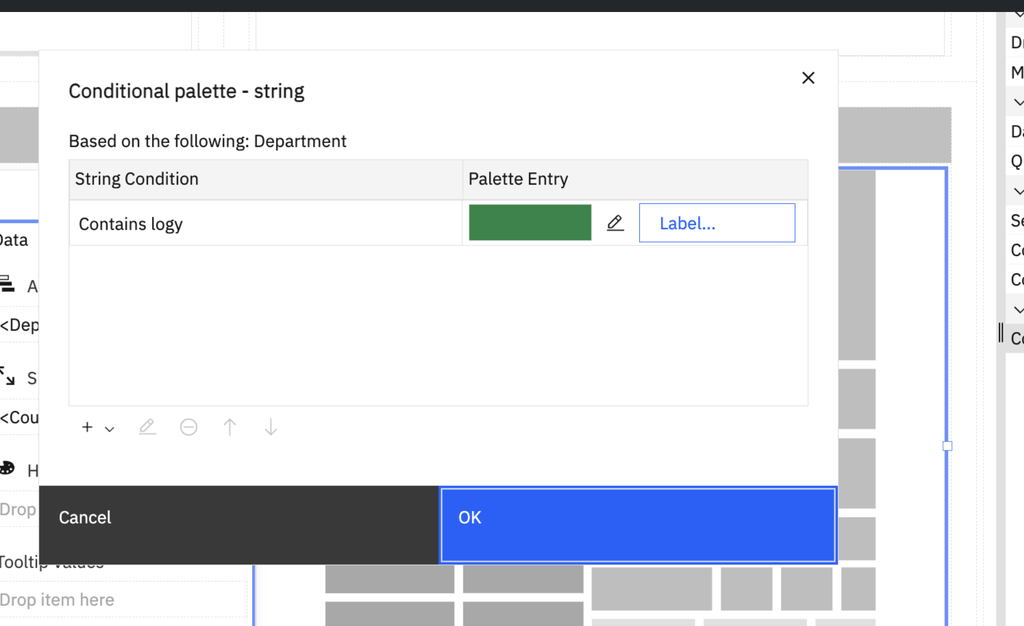
Click OK to save the configuration and return to your report.
Note: Once conditions are created, you can further customize the palette:
- Edit a condition to modify its configuration.
- Change the color and transparency of individual palette entries.
- Add labels to identify conditions.
- Delete unwanted conditions.
- Move conditions up or down to control their priority.
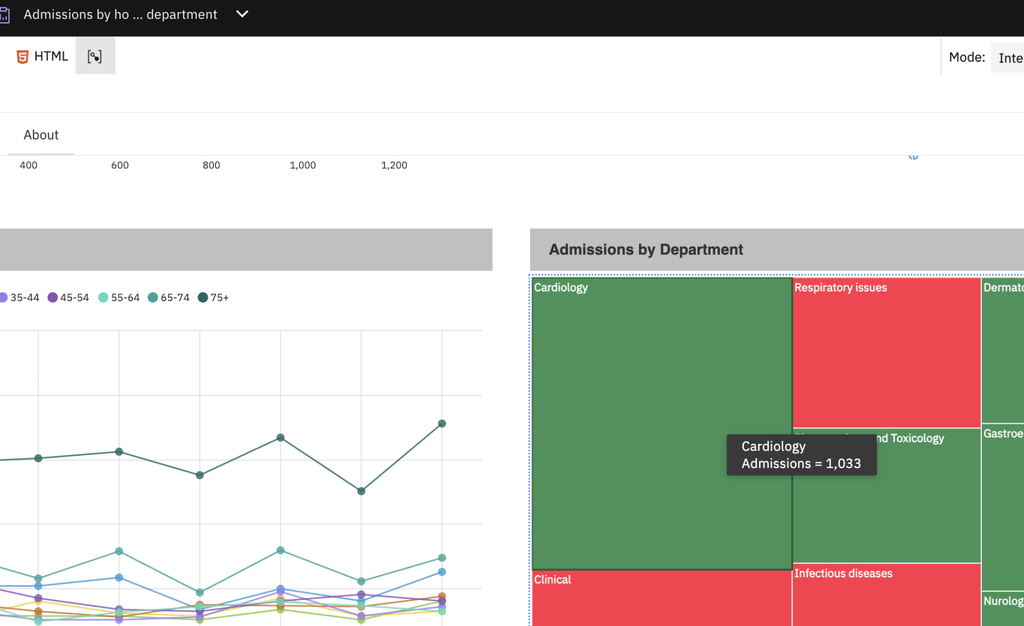
Run the report in HTML to verify that the conditional colors are applied correctly.